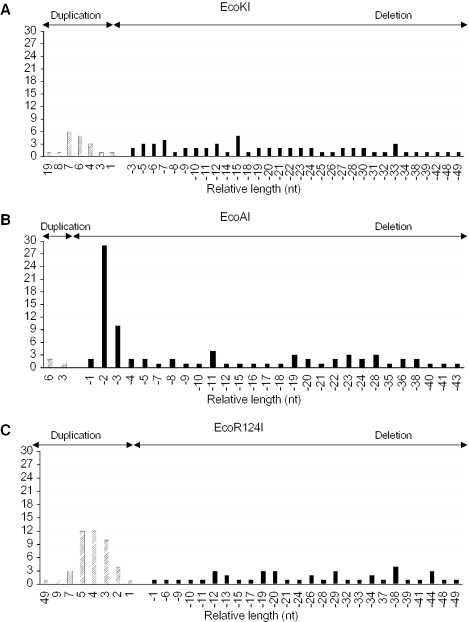
Figure 3.
Distribution of deletions and duplications in selected clones. The lengths of deletions (black bars) and duplications (hatched bars) are plotted against the number of clones for EcoKI (A), EcoAI (B) and EcoR124 (C). Deletions indicate the presence of 3′-overhangs, while the duplications indicate the presence of 5′-overhangs. Clones with deletions up to 50 nt were considered for this analysis.

