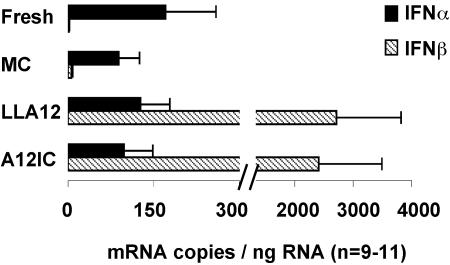
FIG. 5.
Absolute quantitative analysis of IFN-α and IFN-β mRNA expression. RNAs from freshly isolated DC (fresh) or DC cultured for 3 h in the absence (MC) or presence of the A12-IC or LLA12 virus were analyzed by real-time PCR. The total cellular RNA levels used for each sample were measured and expressed in nanograms based on a standard curve included in each assay. The number of mRNA copies for each cytokine was calculated based on a standard curve prepared for each gene and included in each assay. Data are reported as means (n = 11) ± SE.

