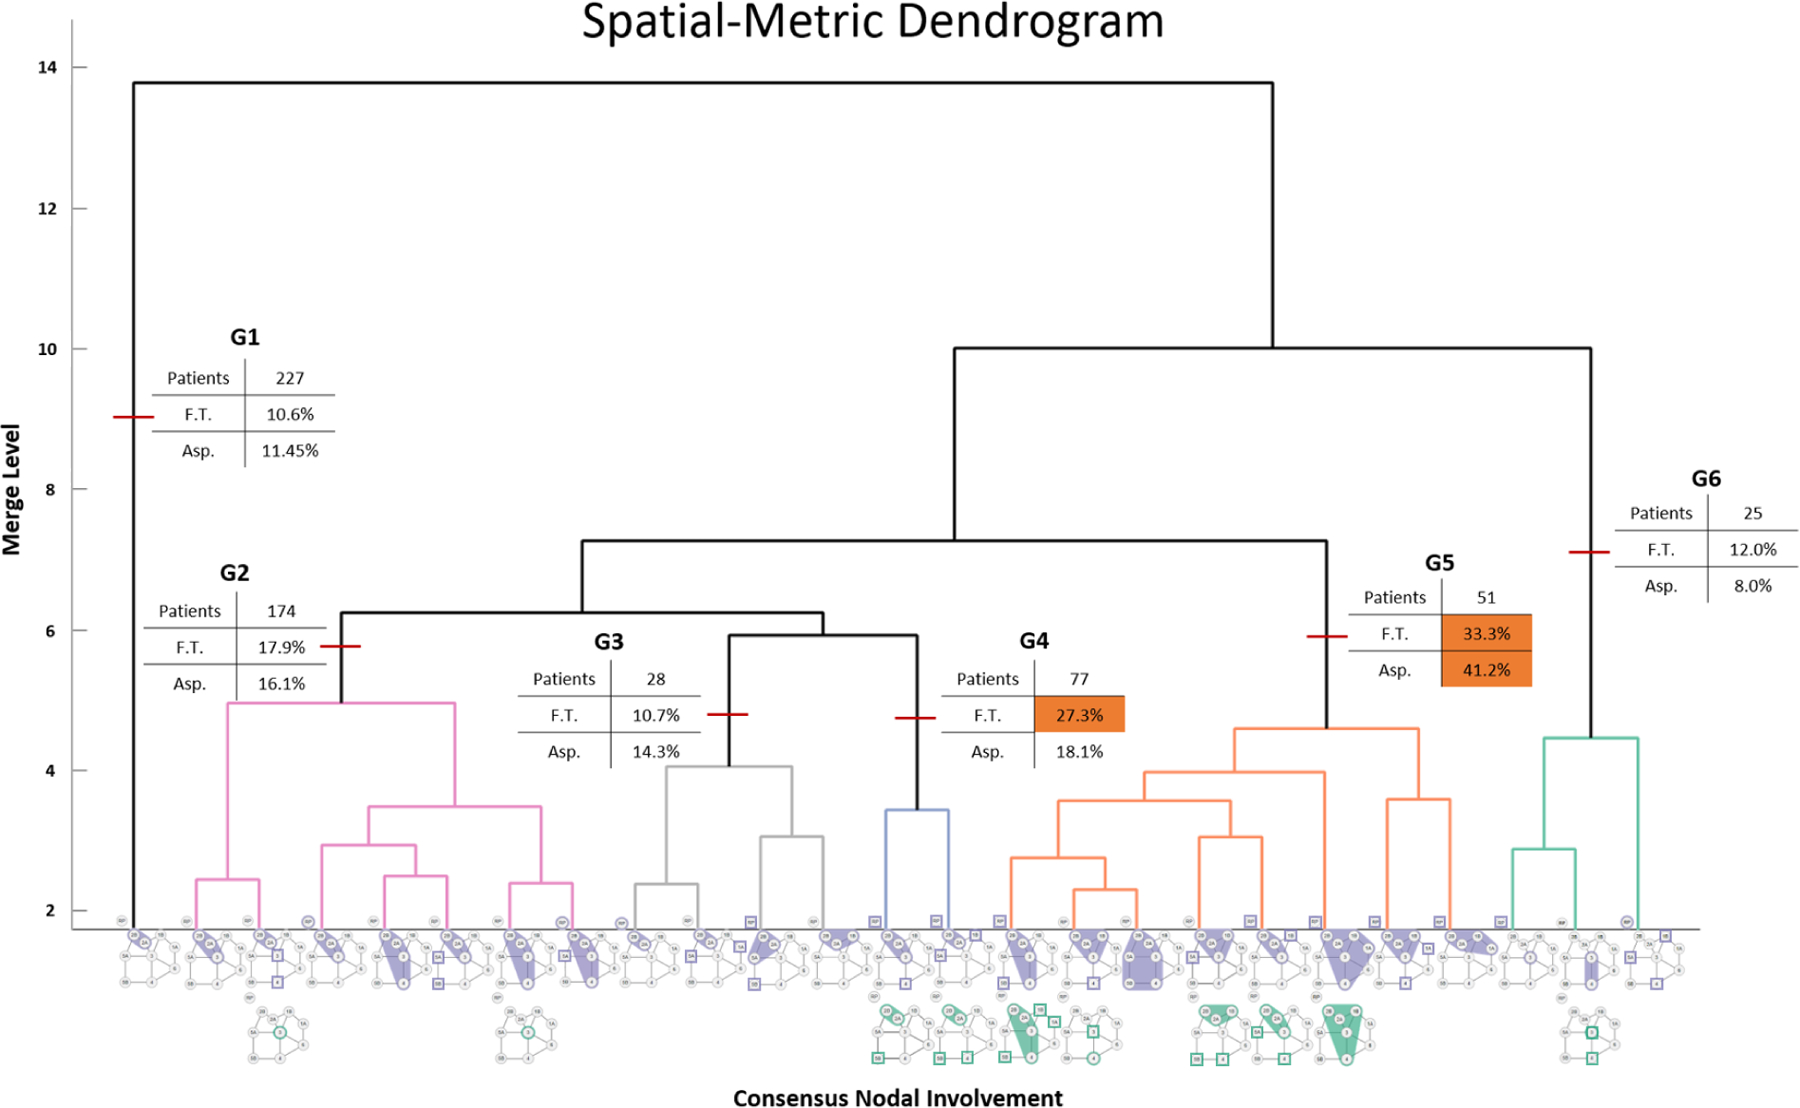
Figure 6:

Dendrogram showing patient spatial groups (indicated by arrows) and toxicity correlates. A clear distinction between bilateral and unilateral nodal spread can be seen between groups G3 and G4, as well a divide between patients with and without LN level 3 involvement (G4 and G5). The consensus involvement (67%) of each group is shown along the x-axis.
