Figure 6.
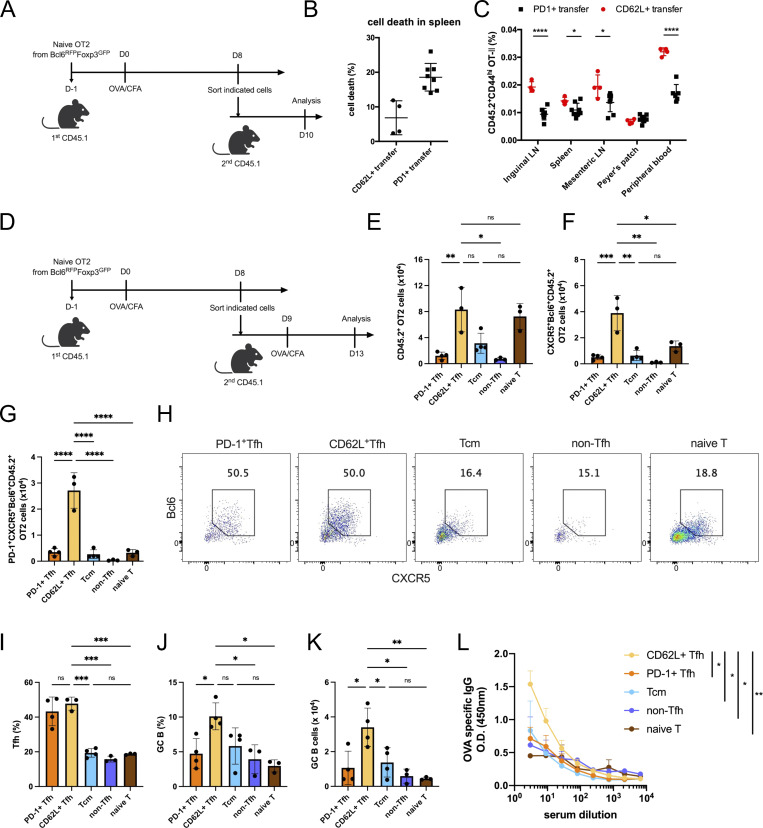
CD62L-expressing Tfh cells give rise to effector Tfh cells in the secondary immune response. (A) Schematic diagram of PD-1+ or CD62L+ Tfh cell adoptive transfer. (B) Cell death rates in CD45.2+ OT-II+ CD4+ T cells in the spleen from CD45.1 recipient mice adoptively transferred with PD-1+ or CD62L+ Tfh cells. (C) CD45.2+ OT-II+ CD4+ T cell percentages in indicated tissues from CD45.1 recipient mice adoptively transferred with PD-1+ or CD62L+ Tfh cells. (D) Schematic diagram of PD-1+ or CD62L+ Tfh cell adoptive transfer and OVA immunization. (E–G) Absolute numbers of (E) CD45.2+OT-II+CD4+ T cells, (F) CD45.2+OT-II+ CD4+CXCR5+Bcl6+ Tfh cells, or (G) PD-1+CD45.2+OT-II+ CD4+CXCR5+Bcl6+ Tfh cells in mice adoptively transferred with indicated cells on day 5 after OVA immunization. (H) Representative flow cytometry staining of CXCR5 and Bcl6 in CD45.2+OT-II+ T cells of mice receiving indicated cell types. (I) Statistical analysis of CXCR5+Bcl6+ cell percentages in CD45.2+ OT-II+ T cell derived from indicated transferred mice. (J and K) Statistical analysis of GC B cell percentages (J) and absolute number of mice received indicated cells (K). (L) OVA-specific IgG levels in serum of mice receiving indicated cells were measured by ELISA. Data above are representative of two independent experiments. Data of A–C represent two independent experiments. Data of D–L represent at least three independent experiments. Data are shown as mean ± SD; two-tailed t test (C, E–G, and I–K) or two-way ANOVA (L); *, P < 0.05; **, P < 0.01; ***, P < 0.001; ****, P < 0.0001; ns, no significance.

