Figure 7.
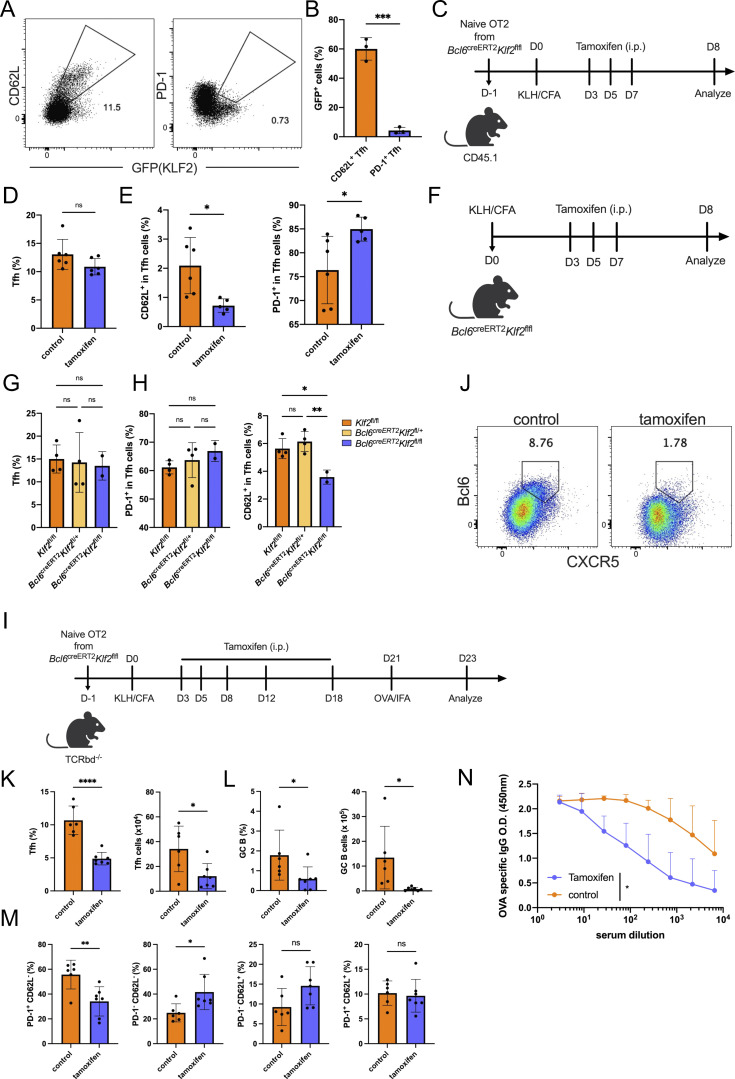
KLF2 regulate the development of CD62L-expressing Tfh cells. (A) Representative expression of KLF-GFP with CD62L and PD-1 in Tfh cells on day 14 after KLH immunization of Klf2GFP Bcl6RFP mice. (B) KLF2-GFP+ cell percentages in CD62L+ and PD-1+ Tfh cells on day 14 after KLH immunization of Klf2GFP Bcl6RFP mice. (C) Experimental workflow of Bcl6creERT2Klf2fl/fl OT-II cell adoptive transfer and immunization experiment. (D and E) Tfh cell percentages in CD4+CD44hi cells (D), and (E) percentages of PD-1+ (left) and CD62L+ (right) in Tfh cells of vehicle- and tamoxifen-treated mice. (F) Experimental workflow of KLH immunization of Bcl6creERT2Klf2fl/fl and control Klf2fl/fl WT mice. (G and H) Tfh cell percentages in CD4+CD44hi cells (G), and (H) the percentages of PD-1+ (left) and CD62L+ (right) cells in Tfh cells of KLH-immunized WT, Bcl6creERT2Klf2fl/+, and Bcl6creERT2Klf2fl/fl mice. Data above are representative of two independent experiments. (I) Experimental workflow of the recall immunization. (J) Representative flow cytometry staining of CXCR5+Bcl6+ cells in CD45.2+CD44hi OT-II cells derived from draining lymph nodes of control and tamoxifen-treated recipient mice. (K and L) Percentages and absolute numbers of (K) CXCR5+Bcl6+ Tfh cells and (L) GL7+Fas+ GC B cells. (M) Proportions of indicated cell populations among secondary CXCR5+Bcl6+ Tfh cells. (N) OVA-specific IgG production in serum from control and tamoxifen-treated recipient mice. Data of A, B, and F–N represent two independent experiments. Data of C–E represent three independent experiments. Data are shown as mean ± SD; two-tailed t test (B, D, E, G, H, and K–M) or two-way ANOVA (N); *, P < 0.05; **, P < 0.01; ***, P < 0.001; ****, P < 0.0001; ns, no significance.

