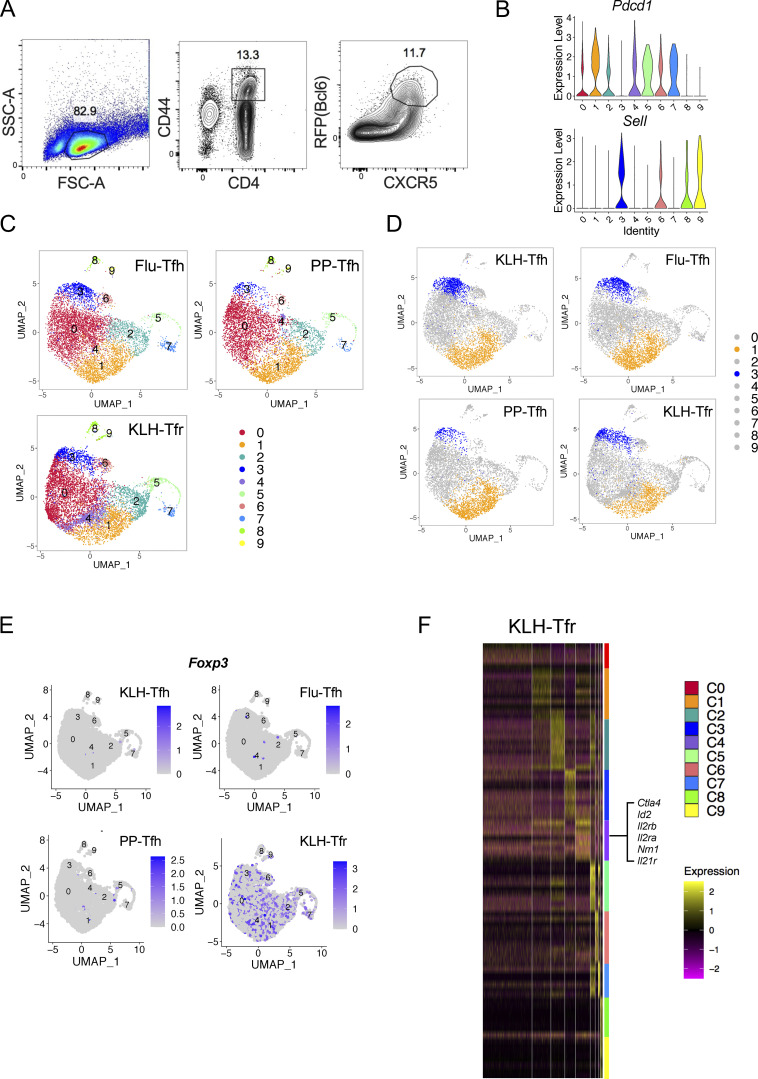
Figure S1.
Heterogeneity of Tfh and Tfr cells revealed by single-cell RNA-seq. (A) The gating strategy of GC-Tfh cells for single-cell RNA-seq. Live CD4+CD44hiCXCR5+RFP+GFP−B220− cells were sorted from draining lymph nodes of Bcl6RFP × Foxp3GFP reporter mice on day 8 after KLH immunization, and single-cell RNA-seq (10x platform) was performed. (B) Violin plots of Pdcd1 and Sell expressions in each cluster. (C) Live CD4+CD44hiCXCR5+RFP+GFP−B220− (GC-Tfh) cells were sorted from PP of Bcl6RFP × Foxp3GFP reporter mice under steady state and draining lymph nodes on day 8 after KLH immunization (KLH), day 9 after influenza infection (Flu) and were used for single-cell RNA-seq (10x platform). Unsupervised clustering of single-cell RNA-seq data of each sample was performed on a UMAP. (D) Cell distribution patterns in each model were shown by UMAP visualization. C1 and C3 were visualized in orange and blue, respectively. (E) Foxp3 expressions in indicated samples. (F) Heatmaps of DEGs in Tfr cells of each cluster. Selected marker genes of C4 were highlighted.

