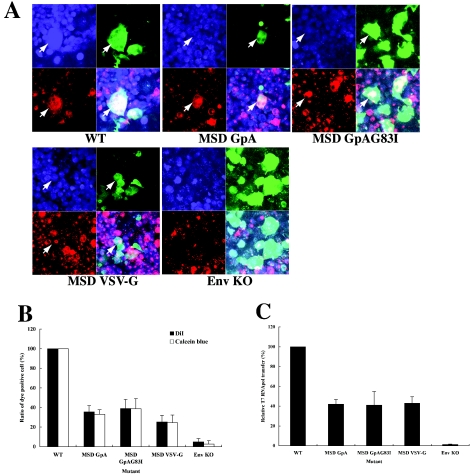
FIG. 6.
Cell-cell fusion analysis. The results of a dye-transfer assay using a coculture system and COS and T cells are shown. The COS7 cells transiently transfected with each pElucEnv construct were cocultured with H9 cells that had been loaded with CellTracker CM-DiI (pseudo-red) and Calcein blue, AM (pseudo-blue). Pictures taken at 2 h after coculture are shown in panel A. Typical fused cells having green, red, or blue fluorescence are indicated by arrows. Original magnification, ×200. (B) Relative dye-transfer frequencies of MSDrep mutants. The number of Env-expressing cells (green cells) whose membranes or cytoplasms are labeled with CM-DiI (red) or Calcein blue, AM (blue), respectively, was counted in five, randomly selected fields. The value was established by setting WT at 100%. The averages of the results from four experiments are shown. (C) Results of T7 RNApol-transfer assay to determine fusion pore formation of MSD mutants. The COS7 cells were transfected with each pElucEnv construct and the T7 RNApol-responsive reporter plasmid, pTM3hRL. At 48 h after transfection, the transfected COS7 cells were cocultured with the 293CD4 cells that had been transfected with pCMMP T7RNApoliresGFP. At 12 h after coculture, the cells were lysed and firefly luciferase and renilla luciferase activity levels were measured. Pore formation efficiencies were calculated by comparing the induced renilla luciferase activity to the firefly luciferase activity. A representative result of four independent experiments is shown.

