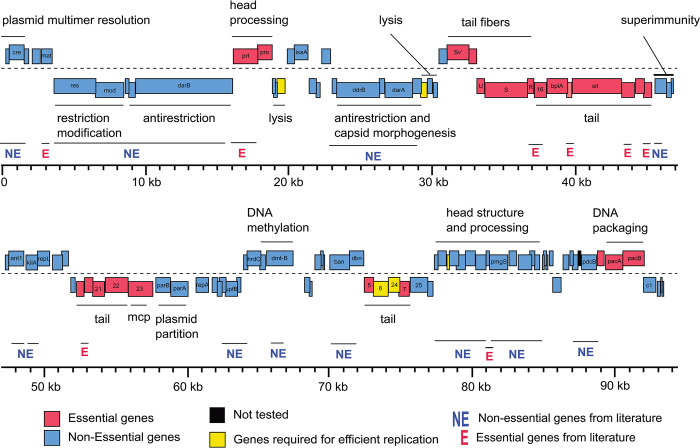
Fig 4. Gene essentiality landscape of phage P1.
The genome-wide map of gene essentiality is shown by calculating the EOP as the ratio of plaques appearing on E. coli BW25113 lawn expressing crRNA targeting respective P1 phage genes to plaques appearing on BW25113 lawn expressing a nontargeting crRNA. The EOP estimations were done by carrying out biological replicates and depicted the average EOP of every gene on the P1 phage genome map (Methods). The underlying data for this figure can be found in Table 2 and S1 Data.

