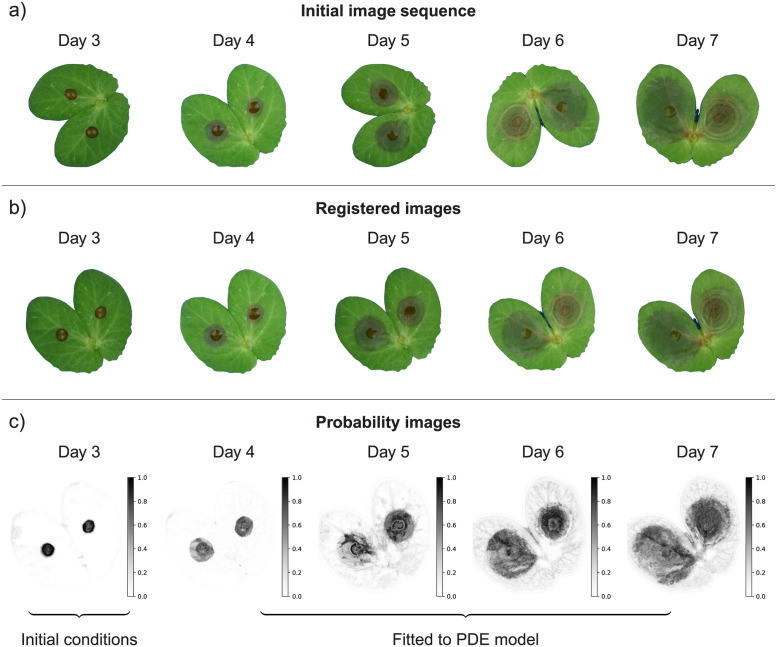
Fig 1. Schematic representation of lesion growth monitoring through imaging.
The initial RGB images (a) are first registered to align stipules in time (b). Afterwards, a supervised segmentation is performed to produce probability maps indicating the probability of each pixel to be in either healthy, symptomatic or background classes. Probability images of the symptomatic state (c) are used for fitting the Fisher-KPP model. Images of day 3 are used as initial conditions while the remaining 4 images are used to estimate the pathogen local growth rate and diffusion coefficient that are actually two distinct life-history traits of within-host pathogen spread.

