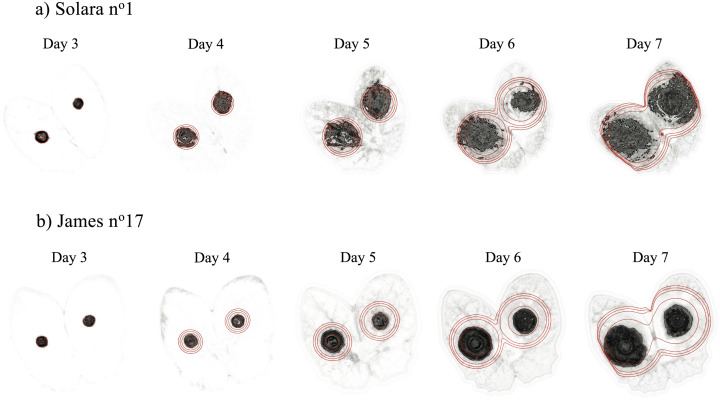
Fig 2. Visualization of model prediction against image data.
The solution of the fitted Fisher-KPP equation, i.e. with optimal estimated parameters , is represented through time by contours (0.2, 0.3, 0.4, 0.5) overlying the probability images of the symptomatic class for example stipules of both cultivars, i.e. Solara n°1 (a) and James n°17 (b). This comparison between the spatial model and the data is also available in S1 and S2 Movies.

