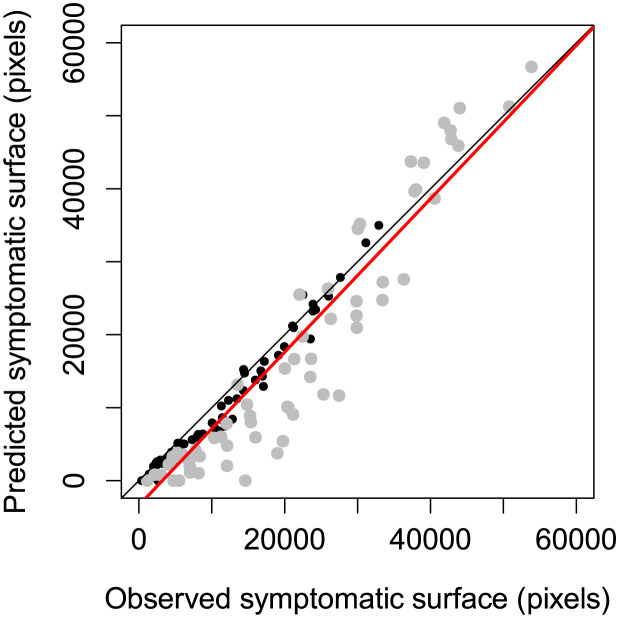
Fig 4. Comparison of symptomatic surface predicted by the reaction-diffusion models against the surface obtained after pixel-based image segmentation for all images used to fit the model.
For each cultivar, i.e. James (black points) and Solara (gray points), there are thus 16 stipules × 4 dates points. The black line is the first bisector that indicates a perfect agreement between values while the red line is the estimated linear relationship between prediction and observation considering all data (slope = 1.05, intercept = −3392.0). In detail, the relationship for James cultivar was better (slope = 1.01, intercept = −1418.7) than for James and (slope = 1.14, intercept = −6947.1).

