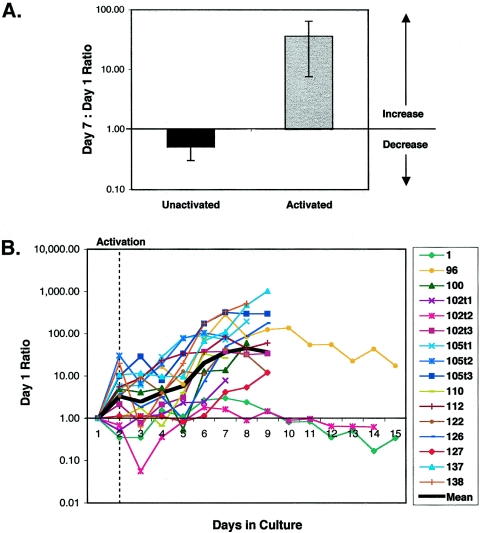
FIG. 4.
Kinetics of HIV-1 virion production following activation of resting CD4+ T cells from viremic patients. (A) Activation increases the rate of virion production from the resting CD4+ T cells of viremic patients. The geometric mean ratio of the virion production rate on day 7 to the virion production rate on day 1 for unactivated and activated cultures is shown. Error bars depict the standard errors of the means. (B) Kinetics of virion production following cellular activation. Purified resting CD4+ T cells from viremic patients were activated with PHA and irradiated allogeneic PBMCs on day 2 in the presence of four antiretroviral drugs. The ratio of virion production on the indicated day to virion production on day 1 is indicated. The heavy black line indicates the geometric mean ratio for all 16 cultures.

