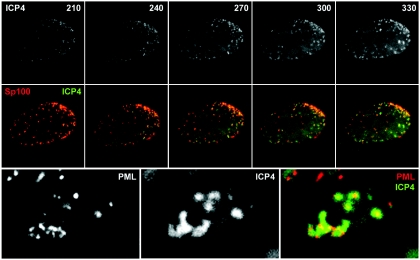
FIG. 4.
(Top row) Selected images from the time series shown in Fig. 3 showing the ECFP signal from ECYP-ICP4. (Middle row) Merged color images showing EYFP-Sp100 (red) and ECFP-ICP4 (green) from the images in the top row and the corresponding images from the time series shown in Fig. 5. (Bottom row) EYFP-PML, ECFP-ICP4, and merged (PML is red, and ICP4 is green) images from the final time point of the time sequence depicted in Fig. 5.

