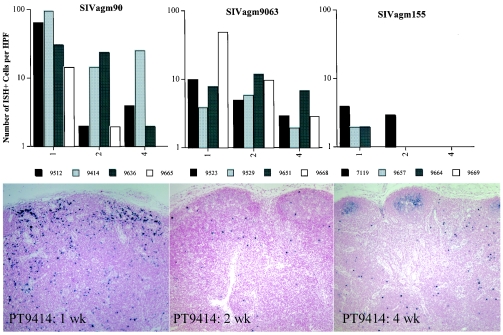
FIG. 3.
SIV-expressing cells in lymph nodes at 1, 2, and 4 weeks after viral inoculation. The top panel shows the number of SIV-expressing cells counted per high power field (HPF) as the average cell number of 10 selected random fields. The bottom panels show representative ISH for SIV expression in sequential samples of lymph nodes from PT 9414, infected with SIVagm90.

