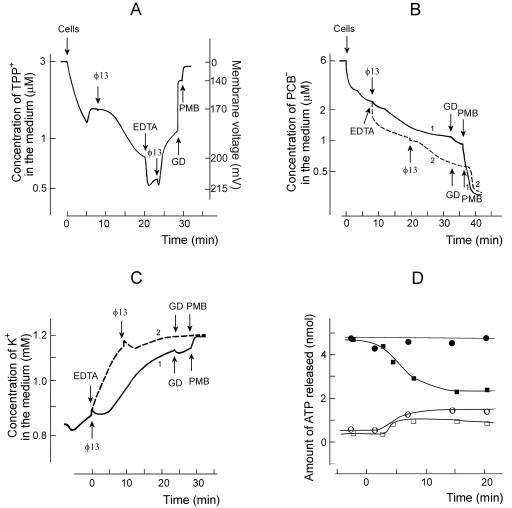
FIG. 5.
Phage and EDTA effects on TPP+ (A), PCB− (B), K+ (C), and ATP (D) content of P. syringae cells. The experiments were performed at 28°C in 100 mM sodium phosphate buffer (pH 8.0). The cells were added to the final concentration of 109 cells/ml (A to C). Unlabeled phage φ13 particles were added to obtain an MOI of 10 after each addition (A to C). EDTA was added to the final concentration of 0.2 mM, and GD and PMB were added to the final concentrations of 4 and 100 μg/ml, respectively. The ATP measurements in panel D were performed as described in Materials and Methods. The cells were infected at time point “0.” Open circles (φ6) and squares (φ13) indicate the amount of free ATP in the cell incubation medium, and the filled circles (φ6) and squares (φ13) indicate the total amount of ATP in the cell suspension. The amount of ATP shown corresponds to 109 of the cells.

