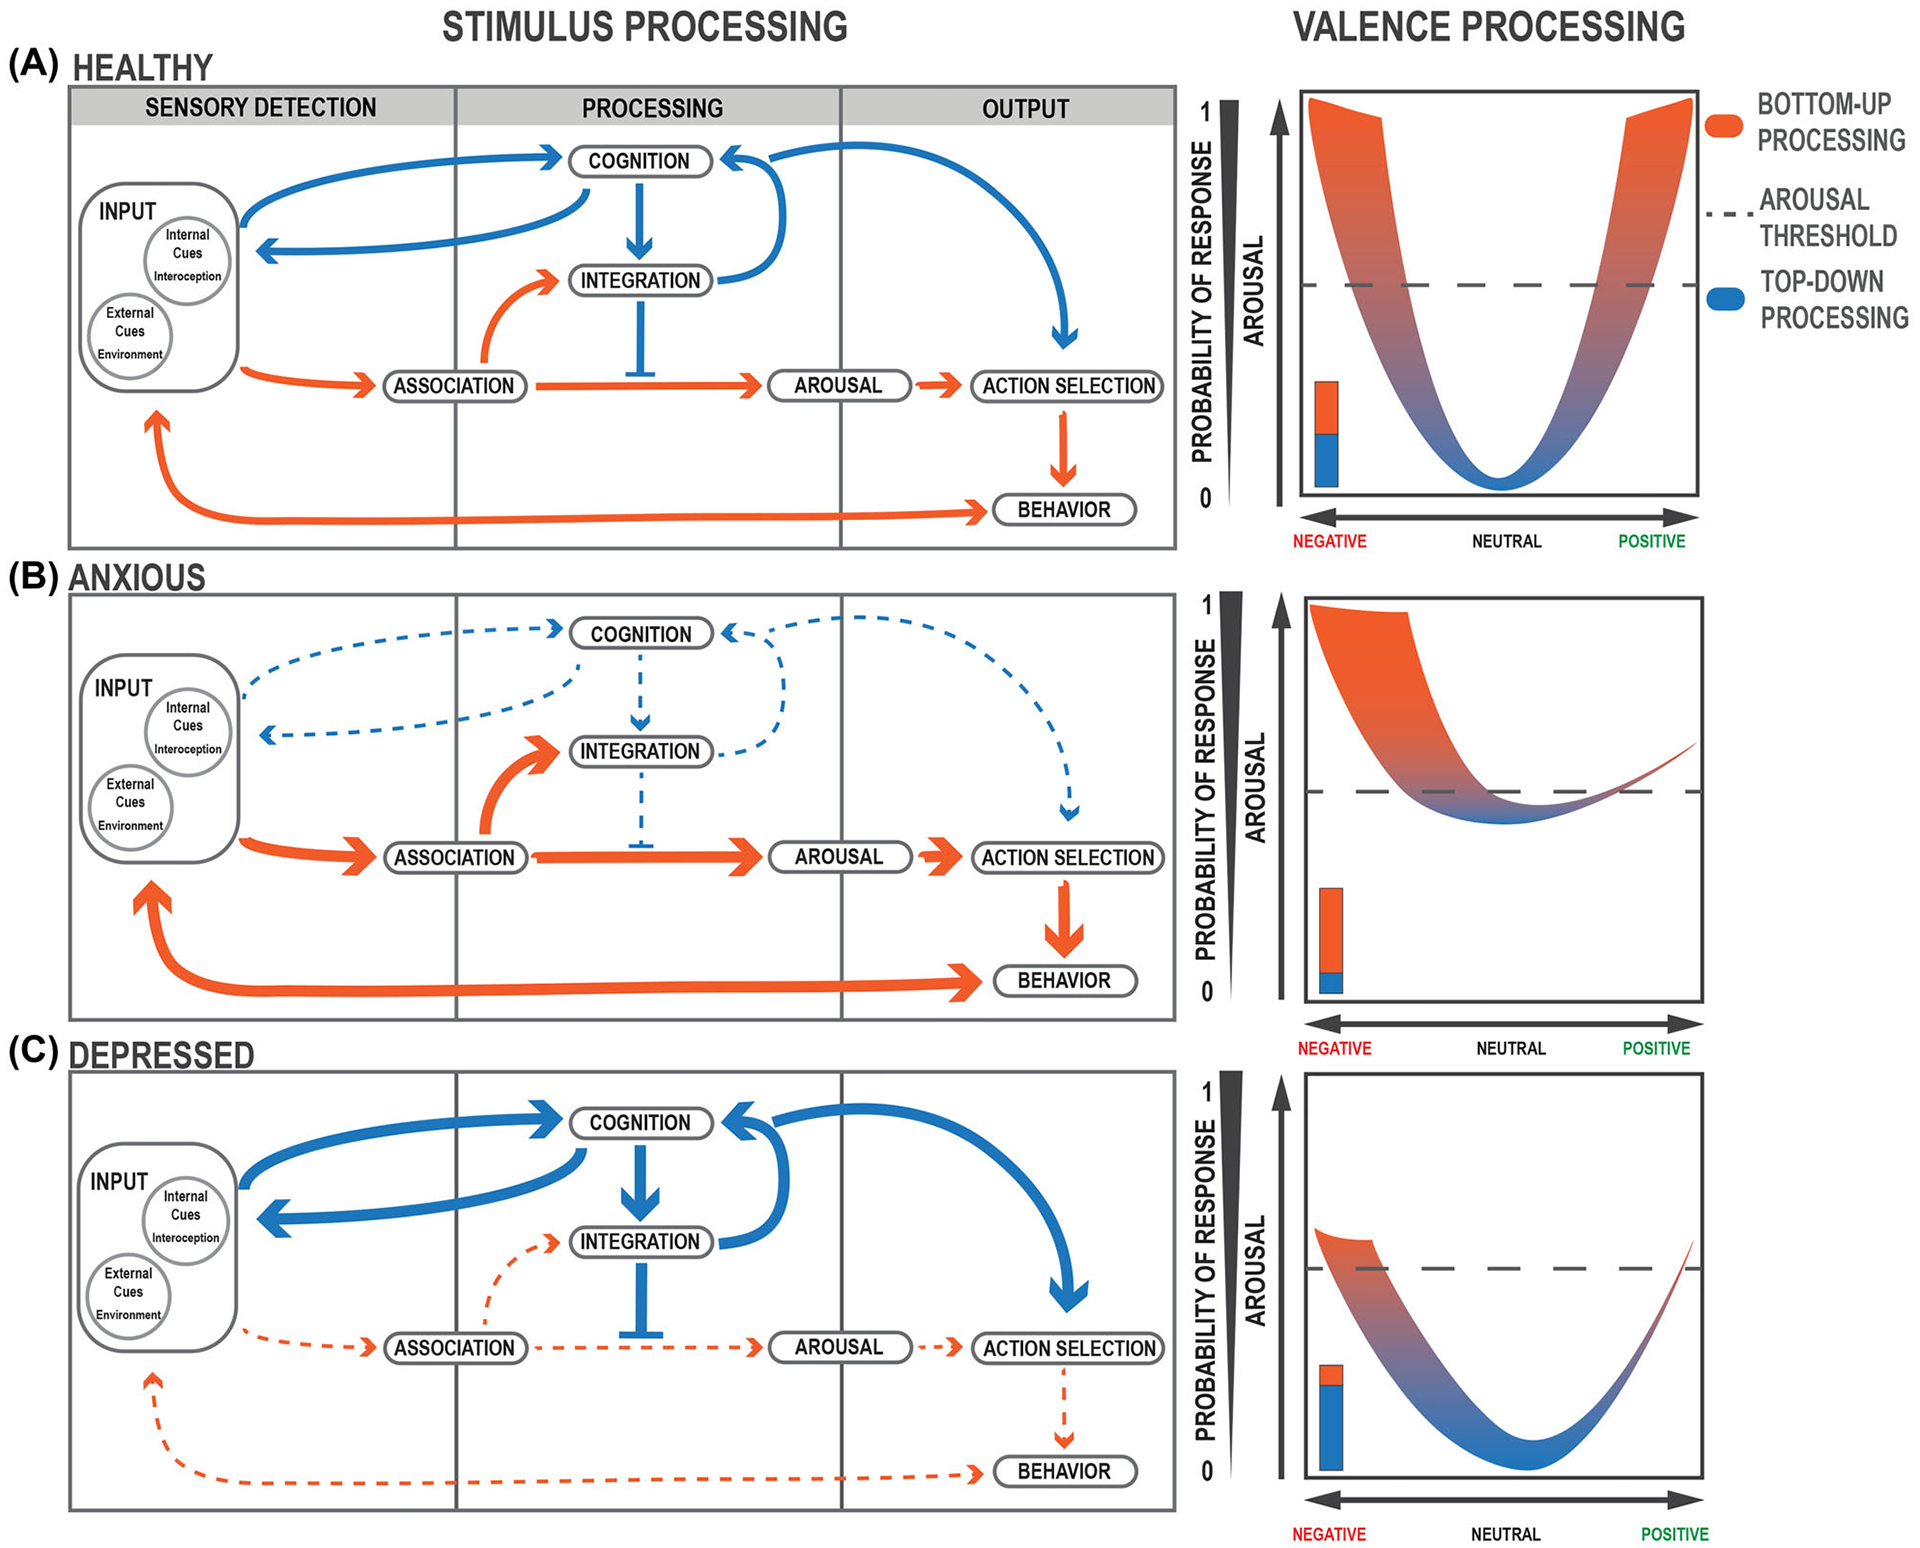
FIGURE 2.

Interaction of bottom-up and top-down feedback loops during stimulus processing. (A–C, left) Flow of stimulus and valence processing in (A, left) healthy, (B, left) anxious, and (C, left) depressed states. Larger, thicker arrows indicate increased bias or activation. Dashed, thinner arrows indicate decreased activation. (A–C, right) Valence processing curves. (A, right) In a healthy state, valence processing corresponds appropriately to increases in arousal and positive–negative valuations of valence. The dashed line indicates the threshold of responding to a given stimulus. (B, right) In an anxious state, arousal is increased with a negative valence bias. (C, right) In a depressed state, arousal is decreased with a negative valence bias.
