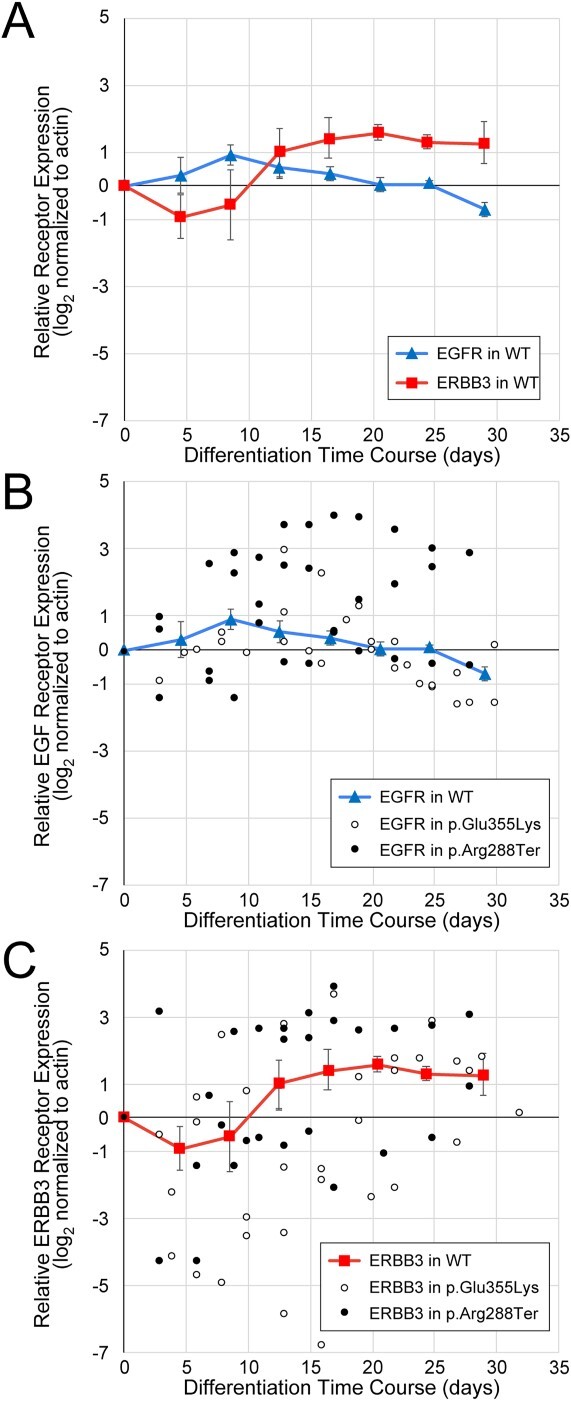
Figure 9.

Dynamics of EGFR and ERBB3 expression during neural crest differentiation. Protein-specific, not phospho-specific, antibodies against EGFR and ERBB3 were used to quantify receptor expression in WT and GM3SD cells across full time courses of differentiation from iPSCs to NCCs (n = 3 independent differentiations for each cell type). (A) EGFR and ERBB3 expression mirror each other as WT iPSCs differentiate to NCCs. For simplicity of presentation and to provide a baseline reference for comparison with GM3SD cells, WT values were combined into bins that span 4 days of differentiation (mean ± SEM, n = 4–6 determinations for each bin, total of 30 data points for each receptor). (B) Individual time points for EGFR abundance are plotted for three independent differentiations of GM3SD cells (n = 27 data points for p.Glu355Lys, n = 32 data points for p.Arg288Ter); WT EGFR profile is reproduced from panel A for reference. (C) Individual time points for ERBB3 abundance are plotted for three independent differentiations of GM3SD cells (n = 37 data points for p.Glu355Lys, n = 32 data points for p.Arg228Ter); WT ERBB3 profile is reproduced from panel A for reference. Table 2 presents P-values for ANOVA and pairwise T-tests of ERBB3 and EGFR expression differences between WT and GM3SD cells during differentiation.
