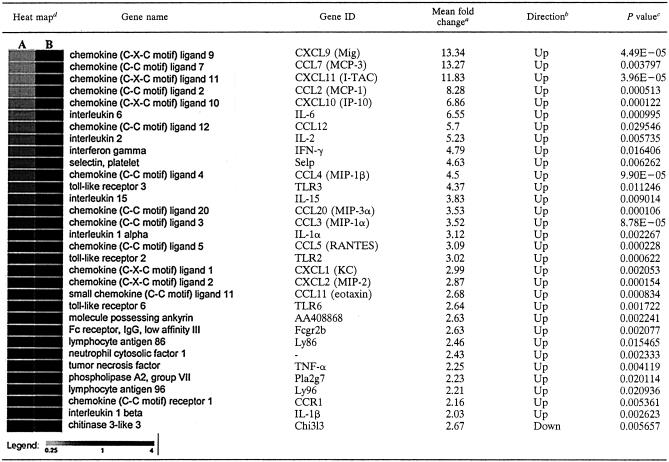
TABLE 3.
DNA array analayses of KyARgp2F- and KyA-infected lungs 12 h postinfection
Presented as the mean fold change from three replicate experiments comparing KyARgp2F and KyA.
Direction of fold change of KyARgp2F relative to KyA.
Statistics for the three replicates of each gene were calculated independently comparing the mean signals of KyARgp2F and KyA using a t test analysis assuming equal variances and six degrees of freedom.
Heat map plots were generated by comparing the signal values of KyA (A) and KyARgp2F (B) using GeneSifter, as described in Materials and Methods.

