
Figure 4.
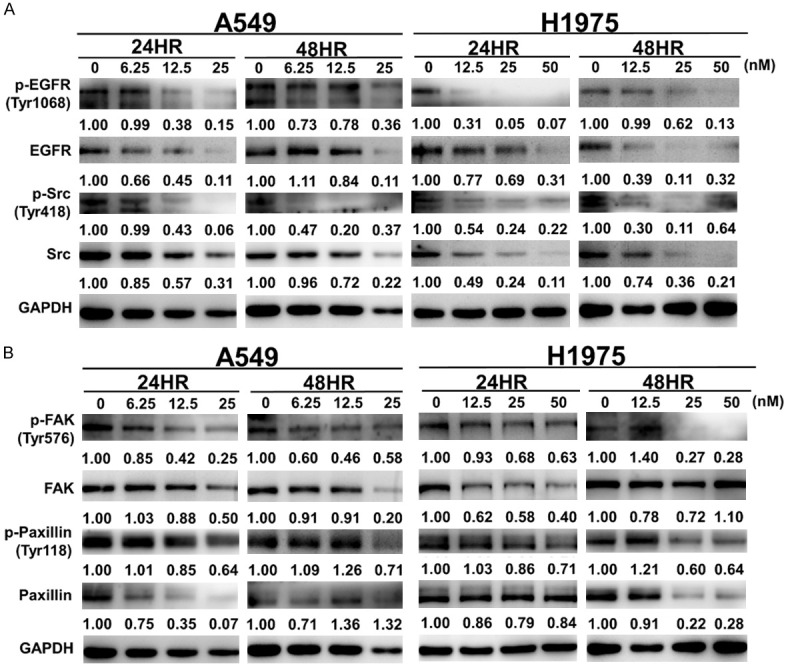
Western blot analysis of the EGFR-related pathway after proscillaridin A treatment. A549 and H1975 cells were treated with the designated concentrations of proscillaridin A for 24 and 48 hrs, and then the cell lysates were used to perform western blot assays with the indicated antibodies. 0 nM: 0.1% DMSO. A. Protein and phosphorylation levels of EGFR and Src. B. Protein and phosphorylation levels of FAK and paxillin. GAPDH was used as an internal control. Protein expression was quantified by ImageJ (NIH), and the result is shown just below the gel graph. Each experiment was performed independently in triplicate.