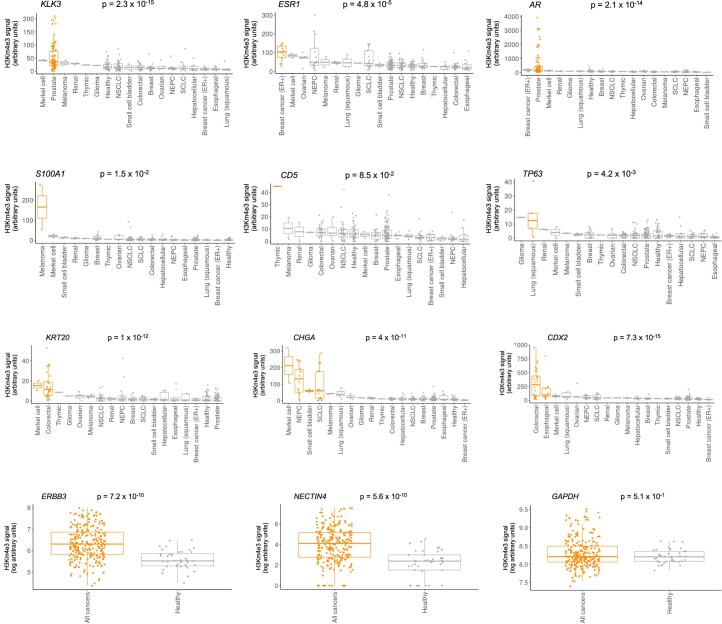
Extended Data Fig. 4. H3K4me3 cfChIP-seq signal at promoters of selected genes of interest.
Promoter H3K4me3 signal is shown at selected genes across N = 202 biologically independent plasma samples stratified by cancer type. Orange indicates cancer types in which the indicated gene is expected to be expressed. Wilcoxon two-sided p-values are indicated for comparison of samples in which expression is expected versus all other samples. For NECTIN4 and ERBB3, signal is compared between healthy volunteer plasma and cancer patient plasma because these genes are expressed across various cancer types. Signal at GAPDH is shown as a control. Lower, middle, and upper hinges indicate 25th, 50th, and 75th percentiles; whiskers extend to 1.5 x the inter-quartile ranges (IQR).

