
FIG. 10.
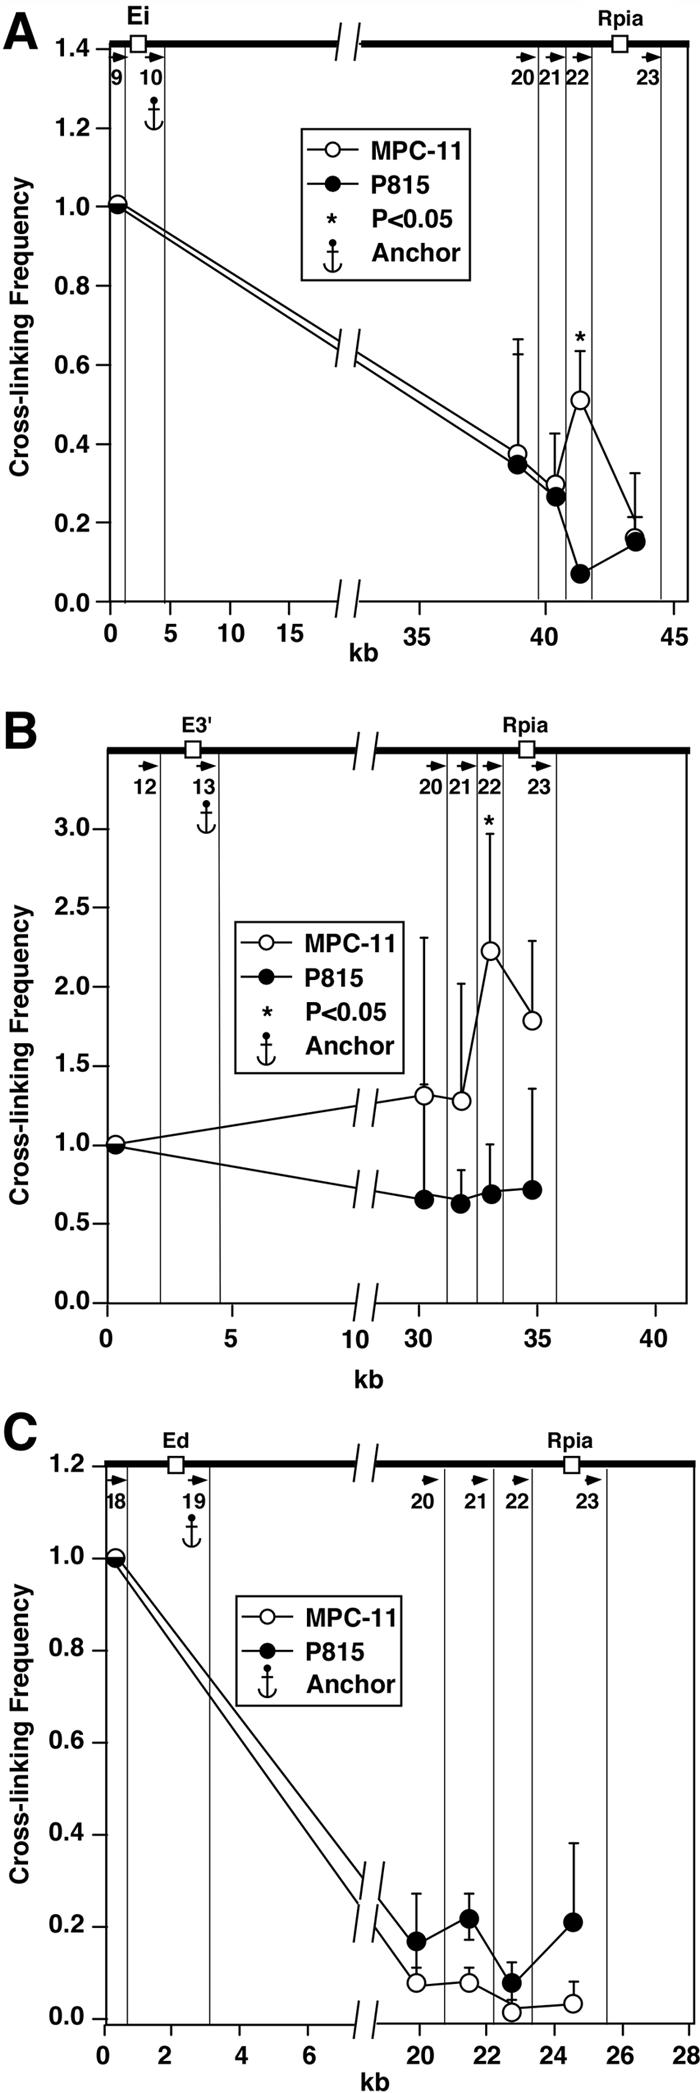
Plasmacytoma-cell-specific looping interactions between the enhancers, Ei and E3′, and a downstream boundary. Quantification of PCR signals with primers 10 (A), 13 (B), and 19 (C). We chose to study the looping interactions between the NspI fragments indicated by the vertical lines.