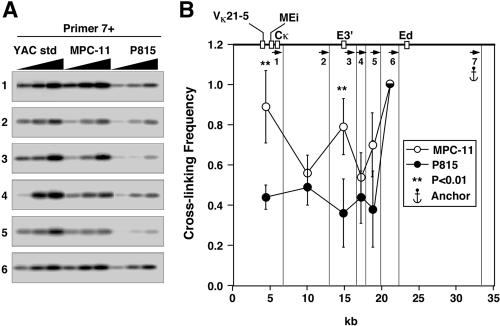
FIG. 4.
Plasmacytoma-cell-specific looping interactions between Ed, E3′, and VκMEi. (A) PCR-amplified ligation products. Primer 7 was used as an anchor and paired with all the other upstream primers. YAC std, YAC standard. (B) PCR signal quantification. The vertical lines show the cutting sites of MfeI, and the arrows indicate the primers used in PCRs. Standard deviations of the means are indicated. Significant differences are in comparison to P815. The most 5′ MfeI cut sites are not shown and differ for κ+, κf, and κ° alleles, generating restriction fragments that are 7.8, 6.7, and 18.3 kb long, respectively, each with the same 3′ end complementary to primer 1. Those derived from MPC-11 cells possess the entire Vκ19-17 and Vκ21-5 V genes, along with their upstream regulatory sequences. For simplicity the map at the top of panel B shows only the κf allele of MPC-11 cells.

