
FIG. 9.
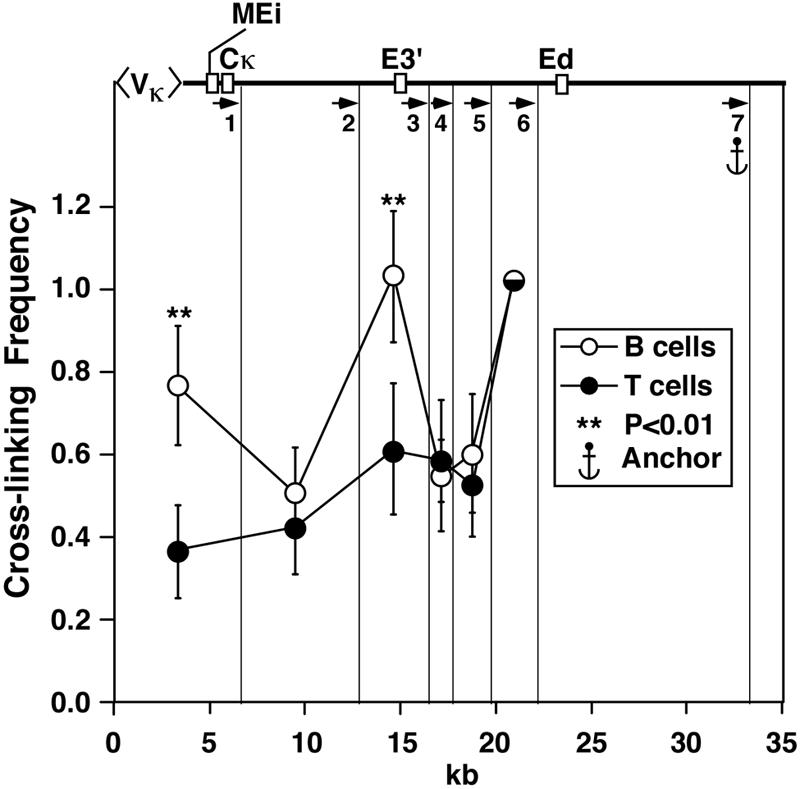
B-lymphocyte-specific interactions between Ed and E3′ and VκMEi, presented as described in the legend to Fig. 4. Quantification of PCR signals with primer 7 as an anchor is shown. Significant differences are in comparison to P815. The vertical lines indicate the MfeI cutting sites.