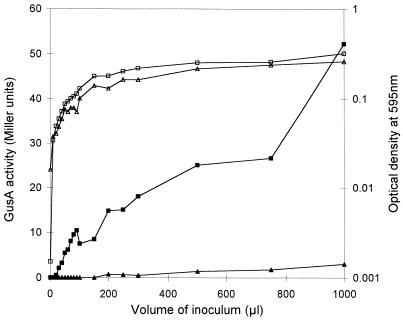
FIG. 5.
Comparison of cell density-dependent expression of raiI in wild-type and raiI mutant backgrounds. Expression of the raiI::gusA fusions was monitored by using p-nitrophenyl-β-d-glucuronide as a substrate. Values for optical density and Miller units were based on measurement in microtiter plates. Curves show averages from three separate experiments. Squares, CNPAF512::pFAJ1328 (raiI::gusA in a wild-type background); triangles, FAJ1328 (raiI knockout mutant); open symbols, optical density at 595 nm; solid symbols, GusA activity in Miller units.

