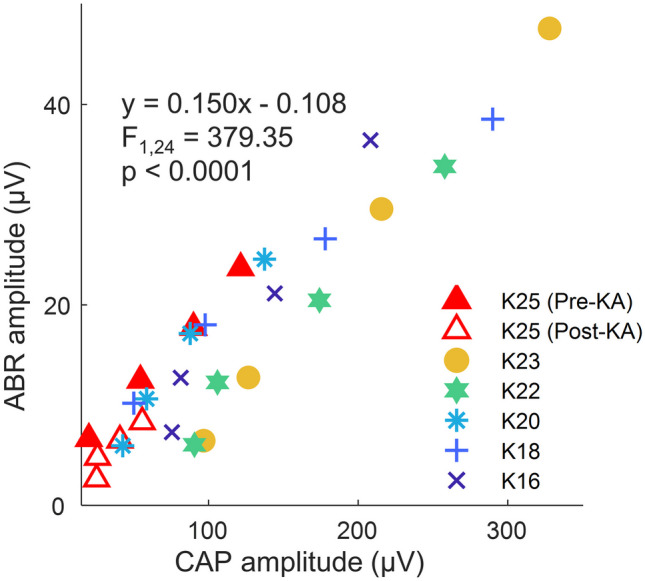
Fig. 10.

Correlations between the amplitude of auditory brainstem response (ABR) wave I amplitude with CAP amplitude in the same ears. Responses were recorded using click stimuli at 60, 70, 80, and 90 dB p.e. SPL. The equation displayed is the fit of a linear mixed-effects model with a random effect of individual ears. Data from one ear (K25; triangles) were obtained both before and after KA exposure
