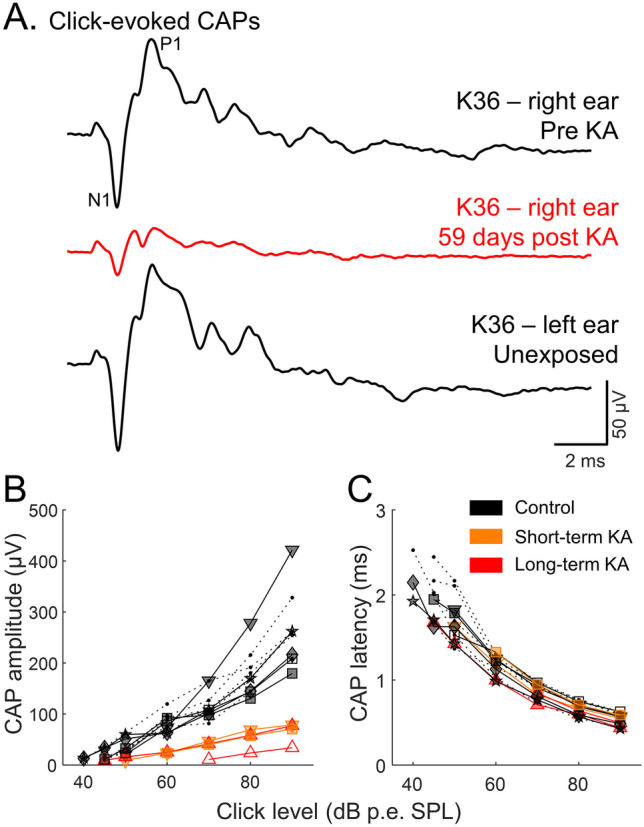
Fig. 6.

Representative click-evoked compound action potential (CAP) waveforms (A) recorded before and 59 days post KA. The CAP waveform of the unexposed (left) ear is also shown. CAP amplitude was calculated as P1 – N1. KA exposure reduces click-evoked CAP amplitude (B) without affecting CAP latency (C). Data from animals that had both histological and physiological quantifications are presented by symbols other than filled circles with dashed lines: up-pointing triangle (△) bird K25; down-pointing triangle (▽) bird K24; square (□) bird K36; diamond (◇) bird K33; star (☆) bird K35
