FIG. 4.
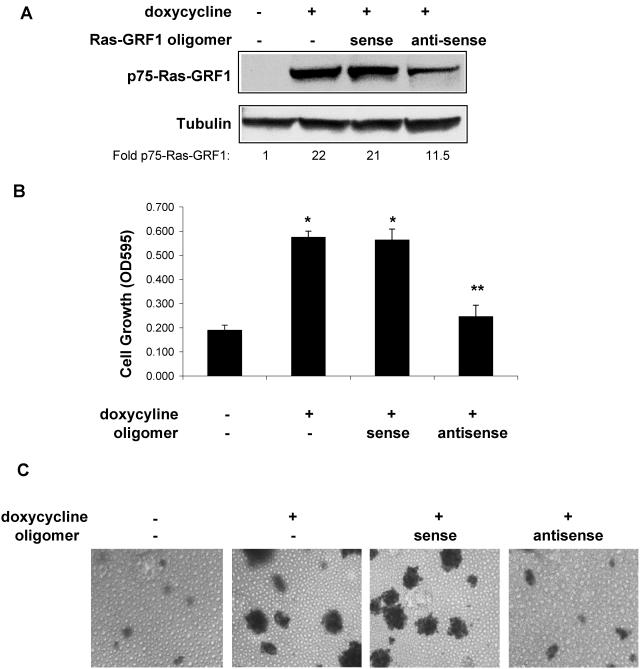
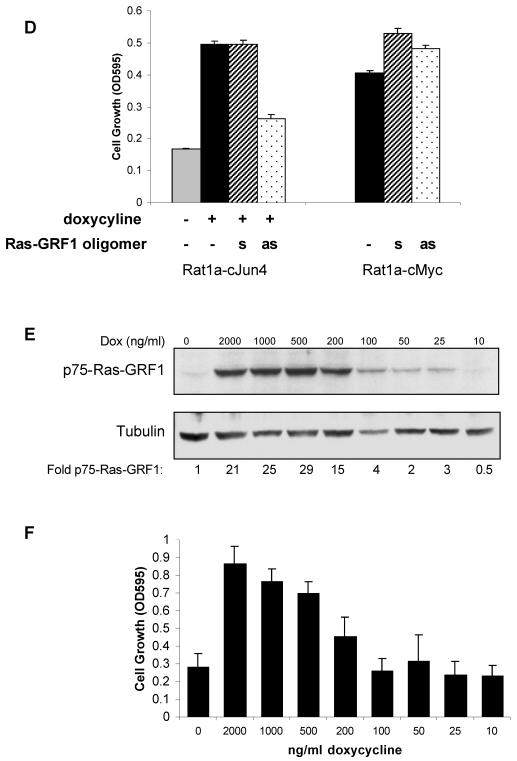
p75-Ras-GRF1 expression is essential for c-Jun/AP-1-regulated anchorage-independent growth. (A) Sense and antisense Ras-GRF1 oligomers (10 μM each) were incubated with nonadherently grown Rat1a-c-Jun4 cells in the presence of 2 μg of doxycycline per ml for 48 h. Proteins were resolved by SDS-polyacrylamide gel electrophoresis and immunoblotted for Ras-GRF1 and tubulin expression. The fold change in p75-Ras-GRF1 compared to the level in the control (without doxycycline) is shown. (B) Anchorage-independent growth of Rat1a-c-Jun4 cells in 1.5% methylcellulose in the presence of doxycycline and 10 μM Ras-GRF1 sense and antisense oligomers for 5 days. Cell growth was measured with MTT assays (Promega) and is representative of the mean ± standard deviation of triplicate samples. *, P ≤ 0.01 compared to growth without doxycycline. Growth in the presence of doxycycline and antisense oligomers was not significantly different from that in the absence of doxycycline (**, P ≥ 0.05). The data shown are representative of three independent experiments. OD595, optical density at 595 nm. (C) Cells grown as described in panel B were stained with p-iodonitrotetrazolium violet for 16 h at 37°C to observe colony formation. (D) Effect of antisense (as) and sense (s) Ras-GRF1 oligomers on anchorage-independent growth of Rat1a-c-Jun4 and Rat1a-c-Myc cells. Rat1a-c-Myc cells contained constitutive c-Myc expression. The cells were grown with sense and antisense oligomers as described for panel B. (E) Western blot analysis for p75-Ras-GRF1 expression in Rat1a-c-Jun4 cells treated with decreasing concentrations of doxycycline. Decreasing the concentration of doxycycline resulted in a decrease in p75-RasGRF1 expression. Tubulin is shown as a loading control. The fold change in p75-RasGRF1 corrected for protein loading compared to the level in the control (without doxycycline) is shown. (F) Anchorage-independent cell growth of Rat1a-c-Jun4 cells grown in the absence and presence of doxycycline at different concentrations for 6 days. Cell growth was measured by MTT assays as described in Materials and Methods. Results are the mean ± standard deviation of growth in 8 wells of a 96-well plate per condition.


