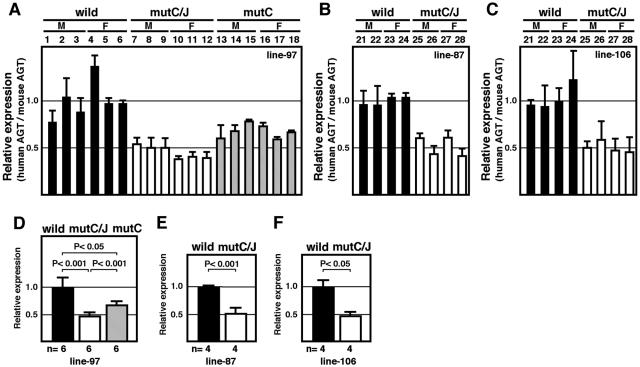
FIG. 3.
Mutation in DR motifs leads to moderate loss of hepatic hAGT expression. (A to C) Liver RNA was isolated from TgM and expression level of human and mouse AGT mRNA was quantitatively analyzed by real-time RT-PCR. Each value represented the ratio of hAGT to mAGT gene expression, which served as an internal control. Relative hAGT/mAGT value for individual mouse was shown after normalization to the average value of wild-type group (see panels D to F), which was arbitrarily set at 1.0. Each sample was analyzed at least three times and the mean ± standard deviation are shown. (D to F) The means ± the standard deviations of individuals in each group in panels A to C were summarized. P values were determined by using the Student t test. A and D, line 97; B and E, line 87; C and F, line 106.

