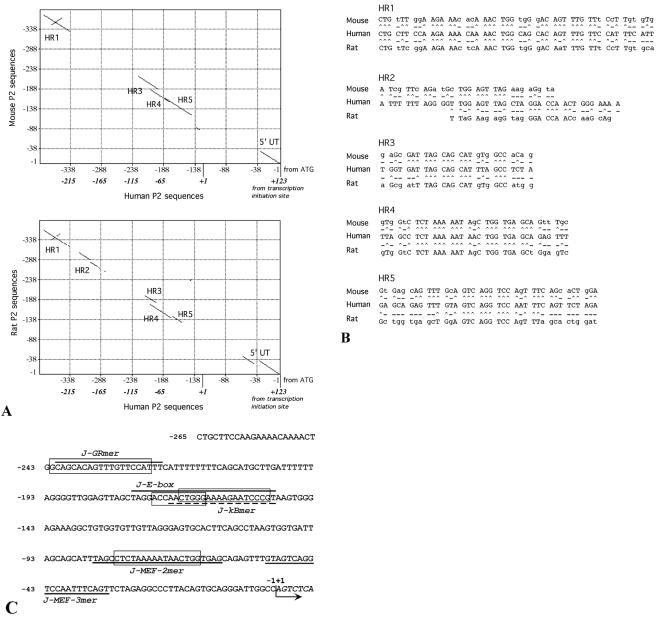
FIG. 5.
(A) Dot-matrix comparison of the human AβH-J-J P2 promoter −265 to +123 nucleotide sequence performed with respect to the murine (up; National Center for Biotechnology Information data bank accession number AF289199) and rat (down; EMBL Nucleotide Sequence Database accession number AJ865348) counterpart (−1 to −388 from ATG) by the use of MacVector sequence analysis software. Lines represent homologies between the analyzed sequences; homology regions have been identified as HR1, HR2, HR3, HR4, and HR5. (B) Nucleotide sequences present within the HR regions identified (^, conserved nucleotide; -, nonconserved nucleotide). (C) −265 to +7 P2 promoter sequence. Dark lines and boxes indicate the oligonucleotides used in gel shift assays (Table 1) and the sequences homologous to transcription factors binding sites found within the conserved region depicted in panel A. Homologies were obtained by TFSEARCH version 1.3 software and are as follows: GR-box (glucocorticoid response element), 89%; c-Myb and MyoD boxes, 88 and 80%, respectively, with J-E-box; NF-κB box, 67% with J-kBmer; and MEF-2 box, 90%. The arrow indicates the P2 transcription initiation site (+1).

