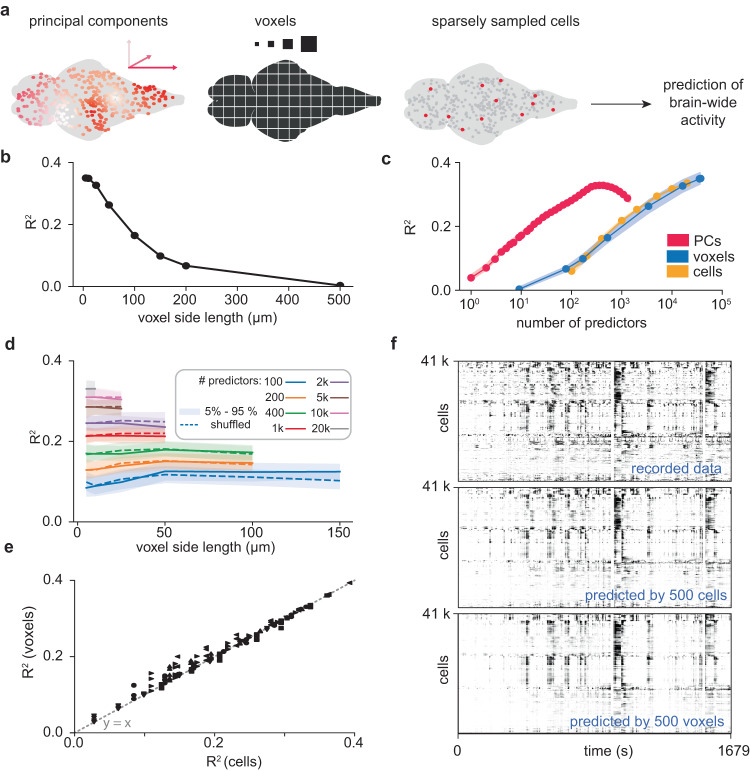
Fig. 4. Scale-invariant predictions: inferring brain-wide activity after subsampling and coarse-graining.
a Schematic overview of subsampling approach. Our aim was to predict all recorded cellular activity via cross-validated regression, quantified by the fraction of brain-wide variance explained (R2). Tested predictors included principal components, voxels of varying sizes, and sparsely sampled cells. b Variance explained as a function of voxel size. c Variance explained as a function of predictor number (principal components, non-empty voxels, randomly sampled cells). Data are presented as mean and the range between 5th and 95th percentile. d Variance explained as a function of voxel size, from µm-range (individual cells) to 150 μm large macrovoxels. Different colors indicate different numbers of randomly sampled voxels of a given size. Additionally, we computed the same metric after randomly shuffling the correspondence between temporal activity and spatial coordinate, thereby destroying spatial structure (dashed line). Data are presented as mean and the range between 5th and 95th percentile. e Correlation plot for the R2 values achieved with the same count of either cells or voxels of different size. f Activity maps of recorded activity (top), and predicted activity using 500 cells and 500 macrovoxels of 100 μm size (middle and bottom). Source data are provided as a Source Data file.

