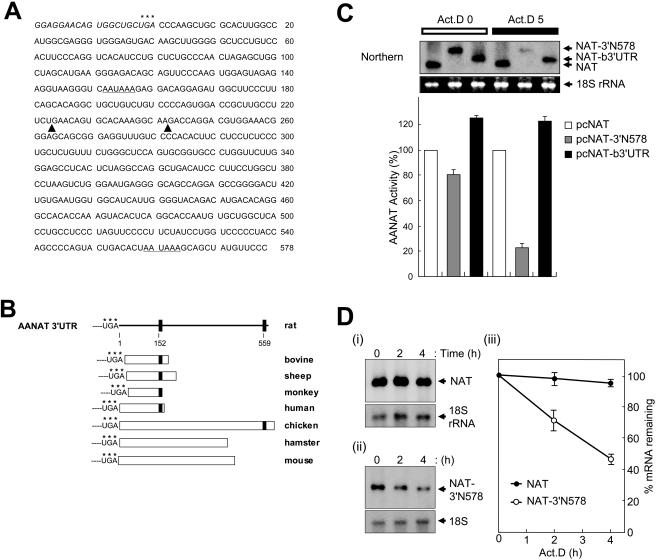
FIG. 1.
AANAT 3′UTR-mediated mRNA degradation. (A) Sequence of rat AANAT 3′UTR RNA (3′N578). The asterisks represent the translation stop codon. Putative poly(A) signals are underlined. The boundaries of deletion mutants shown in Fig. 2A are indicated by solid triangles. (B) Schematic representation of sequence homology comparisons for AANAT 3′UTRs among vertebrate species. Each 3′UTR sequence alignment was performed by using MultAlin (http://prodes.toulouse.inra.fr/multalin/multalin.html). Poly(A) signals are represented by closed squares, and their locations in rat AANAT 3′UTR are indicated as numbers. Accession numbers for the AANAT 3′UTRs shown are as follows: rat, U38306; mouse, AF004108; hamster, AF092100; chicken, U46502; bovine, NM_177509; sheep, U29663; monkey, U46661; and human, XM_008139. (C) Species-specific AANAT 3′UTRs determine their mRNA stability. CHO-K1 cells were transiently transfected with control plasmid pCMV · SPORT-β-gal and reporter plasmids pcNAT (open bar), pcNAT-b3′UTR (gray bar), or pcNAT-3′N578 (closed bar) as shown in Fig. 2A, incubated for 6 h, and then harvested (Act.D 0), or incubated with 5 μg of actinomycin D/ml for a further 5 h before harvesting (Act.D 5). AANAT activities were determined and normalized against β-galactosidase measurements as cpm/optical density. Values, shown as the means ± standard errors of the means (SEM) from duplicate experiments, are the AANAT activities in pcNAT-3′N578 or pcNAT-b3′UTR-transfected populations relative to those measured in pcNAT-transfected cells, to which a value of 100% was assigned. mRNA levels of reporters were determined by Northern blot analyses (Northern) with the AANAT coding region as a probe. The arrows on the right represent reporter mRNAs, NAT, and 3′UTR-containing NAT (NAT-3′N578 or NAT-b3′UTR). 18S rRNA (18S rRNA), as a control for variation in loading, was stained with ethidium bromide. (D) Kinetic analysis of rat AANAT 3′UTR-containing mRNAs. CHO-K1 cells were transiently transfected with reporter plasmids pcNAT (i) or pcNAT-3′N578 (ii) and incubated for 6 h. Total RNA was isolated from cells at the indicated times after the addition of actinomycin D (Act.D) and were subjected to Northern blot analysis using 32P-labeled DNA probes against the AANAT coding region and 18S rRNA. (iii) Signals were quantitated with a PhosphorImager, normalized to 18S rRNA signals; shown are means ± SEM. For each transfection condition, the AANAT/18S rRNA ratio at time zero was adjusted to 100%.

