FIG. 6.
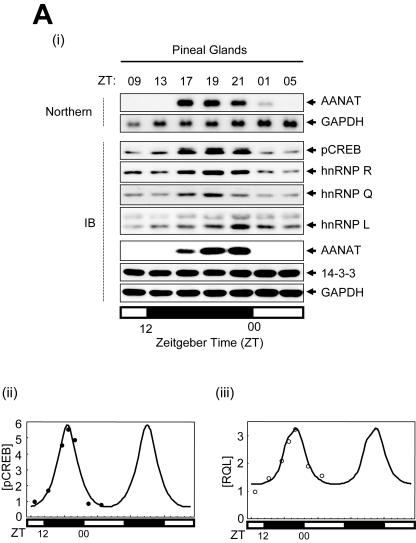
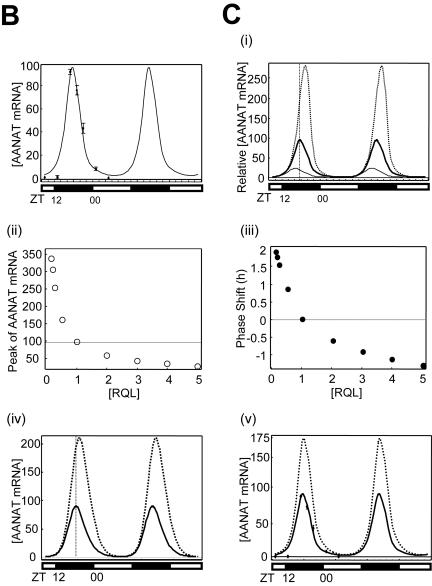
Rhythmic expression of trans-acting factors and mathematical modeling for AANAT mRNA oscillation. (A) (i) Characterization of the rhythmic expression of hnRNP R, hnRNP Q, and hnRNP L in rat pineal glands. Cell lysates extracted from rat pineal glands isolated at different time points as indicated were immunoblotted (IB) with antibodies against pCREB, hnRNP Q, hnRNP R, hnRNP L, AANAT, and 14-3-3 or GAPDH as loading controls. The rat AANAT mRNA levels were characterized over a 24-h period by Northern blot analysis (Northern). The open and closed bars indicate when lights were on and off, respectively. (ii and iii) Kinetics of pCREB, hnRNP R, hnRNP L, and hnRNP Q during the circadian cycle. The level of each factor was fitted with a minimal modification of the cosine function with a 24-h period. The plot fits concentration changes of [pCREB] (ii) and of an average of hnRNP R, hnRNP L, and hnRNP Q, called [RQL] (iii). Curves based on experimentally obtained data for 24 h are plotted twice. (B) Numerical fitting of circadian oscillation in rat AANAT mRNA using the functions pCREB, ICER, and RQL. (C) In silico analysis of the effect of RQL level on the AANAT mRNA rhythmicity. (i) The mRNA levels were simulated by assuming relative basal RQL levels of 1/4 (dotted line), 1 (normal level; thick line), and 5 (thin line), while the other parameters remained normal. The peak point of control data ([RQL] = 1) is marked by the intersection with the vertical dashed line. The effect of the RQL level on peak amplitude (open circles) (ii) and phase shift of peak time (closed circles) (iii) of rat AANAT mRNA is shown. The mRNA levels were simulated by using a differential equation of AANAT mRNA kinetics by removing rhythmicity of RQL level (iv) and by abolishing ICER (v) while other parameters remained normal. Thin and dotted lines represent normal and simulated AANAT mRNA levels, respectively.


