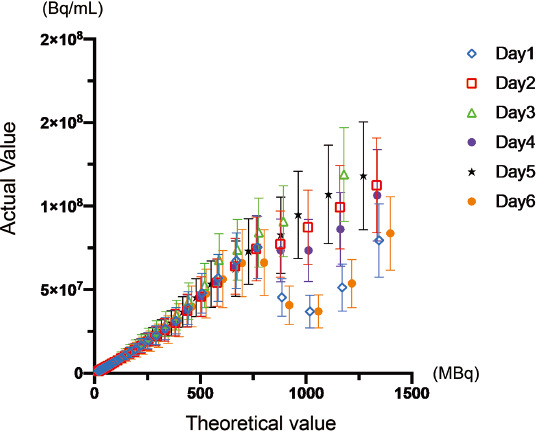
Figure 2 Comparison of measured and reference value for various 13N dose.
The plots of measured and theoretical activity for each session were shown. X-axis indicated the theoretical activity estimated by the radioactive decay from the measured activity in the vial obtained by curie meter prior to PET scan. Y-axis indicated the measured radioactivity of the vial from the PET acquisitions. The plots apparently showed disagreement over the theoretical value of approximately 800 MBq, while they showed a good linearity the range below approximately 400 MBq.
