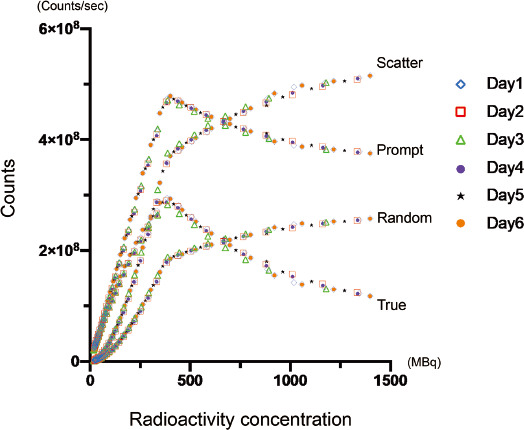
Figure 3 Counting rate performance of mCT scanner for 13N.
The scatter, prompt, random, and true counts derived from all sessions for 6 days were plotted. The curve profile of true counts showed its peak on approximately 300 Mcps, corresponding approximately 360 MBq. Each color and sign indicated 1 to 6 day of sessions as shown in right side of the graph.
