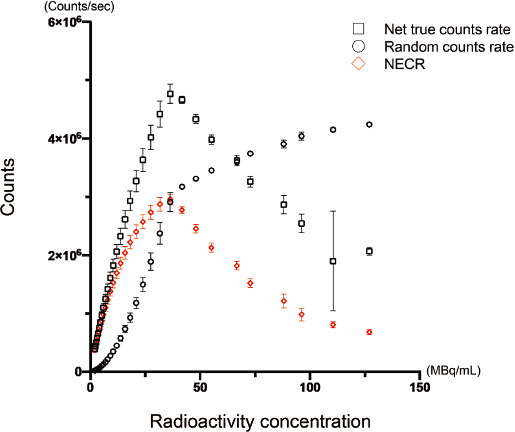
Figure 4 Count rate measurement of 13N.
The relation of measured radioactivity and count rate from PET acquisition was shown. The graph for random coincidence counts rate (circle) and net true count rate (square). X-axis indicated the theoretical radioactive concentration (MBq/mL) estimated by the radioactive decay from the measured activity in the vial obtained by curie meter prior to PET scan. Y-axis indicated the count rate (counts/sec) of the vial from the PET acquisitions. The inclination of the graph for random coincidence counts rate started to decrease at the plot of approximately 3Mcps (approximately 36.3MBq/mL for estimated radioactive concentration). Net true counts rate demonstrated its peak for below 4.8 Mcps (approximately 36 MBq for estimated radioactive concentration). The plots for NECR. The definition of X and Y-axis was similar to graph A. NECR analysis showed the peak for approximately 3.0 Mcps (36.3 MBq/mL for estimated radioactive concentration).
