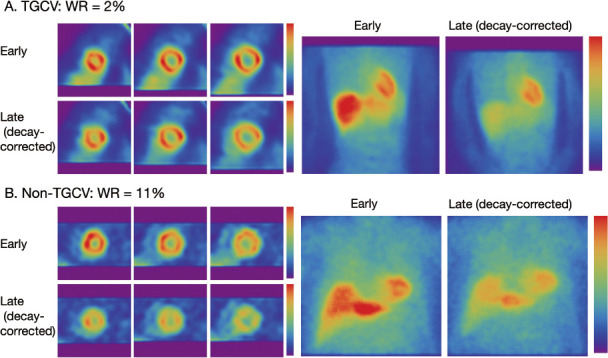
Figure 1 Three short-axis SPECT slices and anterior planar images of patients.
A: Patient with WR 2% and clinical diagnosis of TGCV.
B: Patient with WR 11%. Color scale of late images was corrected for time decay between early and late imaging. This can be achieved either by multiplying counts derived from late images by decay correction factor to the late image or modifying the maximum count in the late image adjusted for time decay. Correction for time decay led to similar heart counts between early and late images in patient A, whereas heart count was decreased in late image in patient B.
TGCV, triglyceride deposit cardiomyovasculopathy; WR, washout rate.

