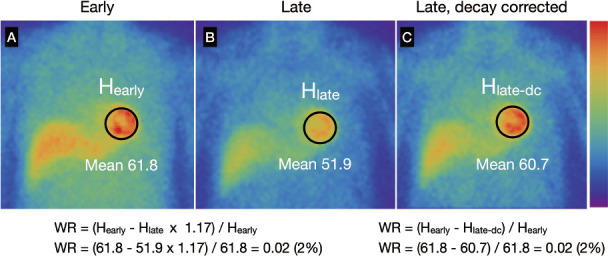
Figure 2 Examples of washout rates calculated using early (A), late (B) and decay-corrected late (C) planar images.
The WR can be calculated from the average heart counts. Background correction is not applied.
Hearly, early heart count; Hlate, late heart count; Hlate-dc, late heart count after decay correction. When interval between early and late images is 3 hours (physical half-life of 123I = 13.2 hours), calculated decay correction factor was 1.17 (Table 2).
WR, washout rate.