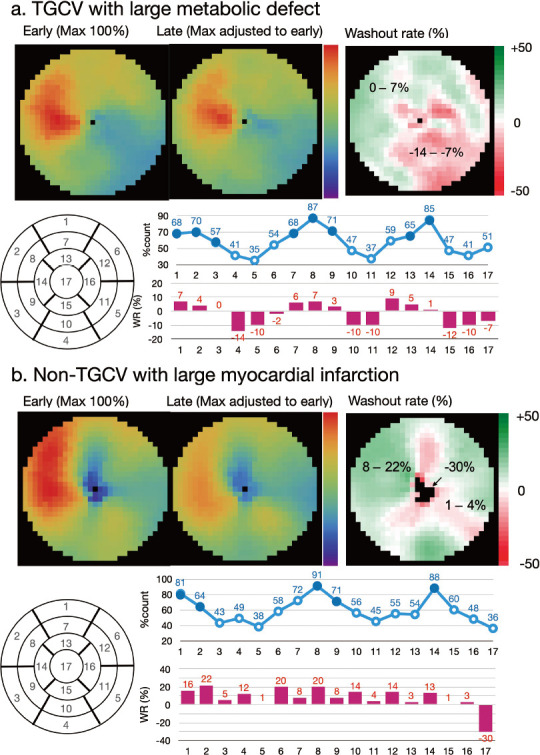
Figure 4 Examples of washout rates calculated from images of patients with metabolic defects.
Line graph (blue), percent-counts (%) in early myocardial count using a 17-segment model. Solid circles indicate segments with preserved accumulation. Bar graph (red) shows regional WR per segment.
Patient A (a) was clinically diagnosed with TGCV. Average anteroseptal WR in metabolically preserved segments was 4.1 %. WR: (mean early count - mean late count)/mean early count was 1%; averaged pixel based, −3%; defective region (inferolateral∔apex) −14% to −7%; Anteroseptal ( ), 0% to 7%.
Patient B (b) had old myocardial infarction and three-vessel disease. WR: (mean early count - mean late count)/mean early count was 9%; averaged pixel based, 0%; infarction (inferolateral), l%–4% and apex, −30%; anteroseptal ( ), 8% to 22%. Average anteroseptal WR in metabolically preserved segments was 15.8% (13%–22%) Adapted from reference (29).
TGCV, triglyceride deposit cardiomyovasculopathy; WR, washout rate.

