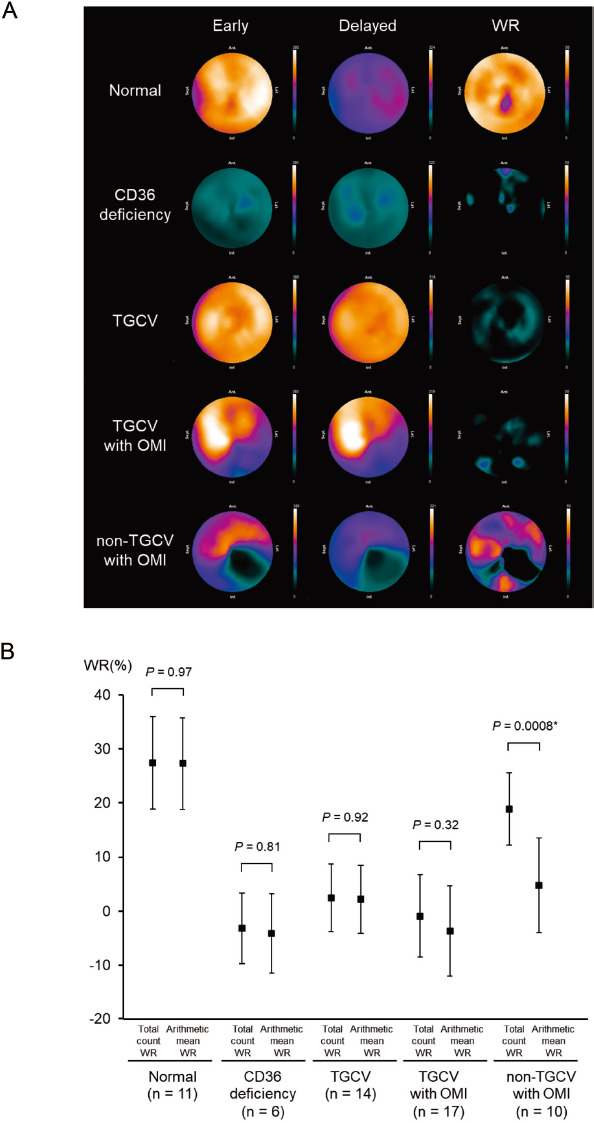
Figure 2 Qualitative and quantitative comparisons of 123I-BMIPP SPECT by disease.
A: Representative 123I-BMIPP SPECT polar map images: the early image (left), the time-decay-corrected delayed image (middle), and the WR (right) are shown. The color scale range of all early images is from 0 to 380 counts, the color scale of delayed images is downscaled to account for time decay correction, and the range of WR is from 0 to 50%.
B: Comparison of the total count WR and arithmetic mean WR: markers show the mean values, and bars indicate the standard deviations. ⋆: statistically significant
123I-BMIPP: iodine-123-β-methyl-p-iodophenylpentadecanoic acid, OMI: old myocardial infarction, SPECT: single-photon emission computerized tomography, TGCV: triglyceride deposit cardiomyovasculopathy, WR: washout rate