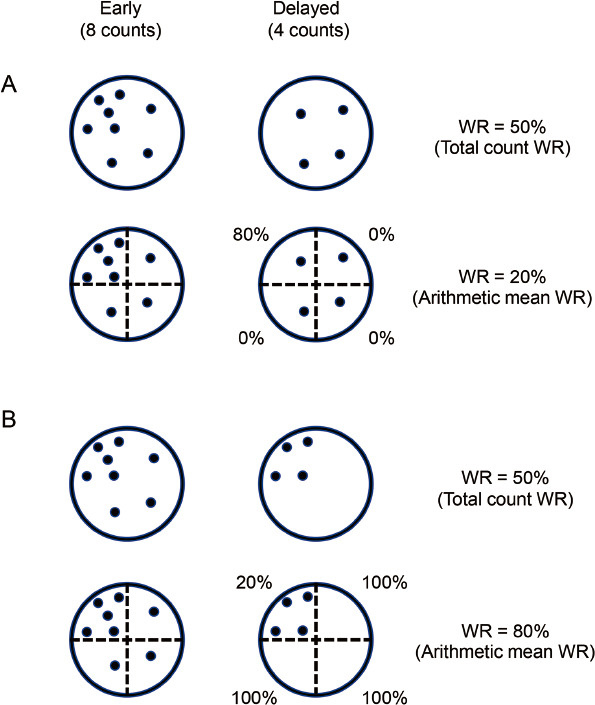
Figure 3 Two theoretical discrepancies between the total count WR and arithmetic mean WR.
Schematic diagram of counts in the ROIs: the early image (left, 8 counts) and the time-decay-corrected delayed image (right, 4 counts) are shown. These models represent tracers that are unevenly uptaken.
A: The total count WR is 50%. This diagram is divided into four segments, and the arithmetic mean WR is 20%.
B: The total count WR is 50%. This diagram is divided into four segments, and the arithmetic mean WR is 80%.
ROI: region of interest, WR: washout rate