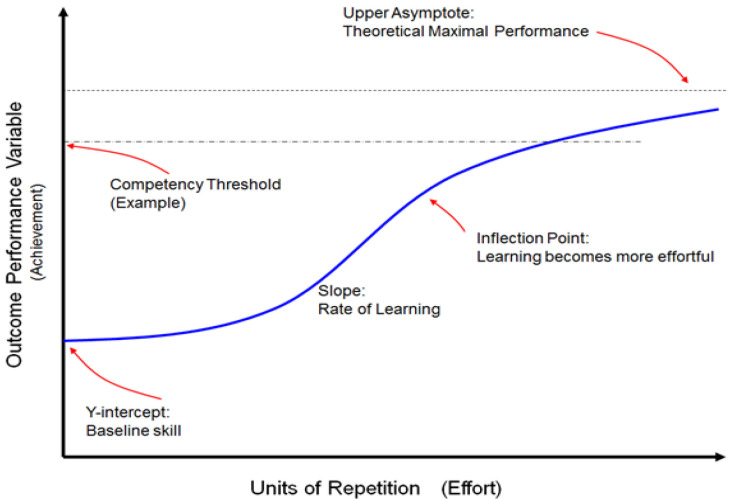
Figure 1. The learning curve demonstrates the relationship of effort (X-axis) and achievement (Y-axis).
The Y-intercept represents a learner’s baseline skill and is followed by a relatively flat latent phase of growth at the beginning of the curve as the learner orients to the learning environment. Learning then accelerates, producing a slope that represents effortful learning. At the next inflection point, basic skills have been learned and further acquisition of expertise becomes more effortful. The competency threshold is a predefined level of achievement. The curve represents how many repetitions are necessary for an individual (or group) to demonstrate competency. Considerable effort can push the learner beyond competency to greater levels of expertise, with the upper asymptote being the theoretical maximum for which the true expert strives. Note that the blue line can represent an individual learner or a group average. Refer to Table 1 for more detailed definitions. This figure is an original figure produced by the authors for this review article.

