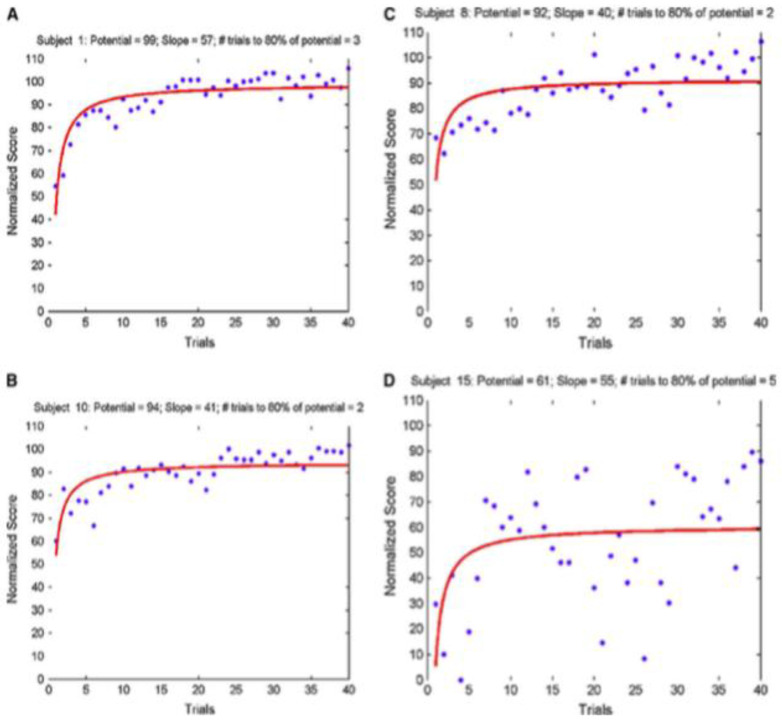
Figure 4. Reproduced with permission from Feldman, Cao, Andalib, Fraser, & Fried, 2009 ( Feldman et al., 2009).
Note the immediate visual differences in this demonstration of the use of small multiples. For example, Subject A started at a lower score than B or C, but reached a similar plateau value. Subject D showed incredible variability, questioning the validity of the learning curve in comparison to the others.

