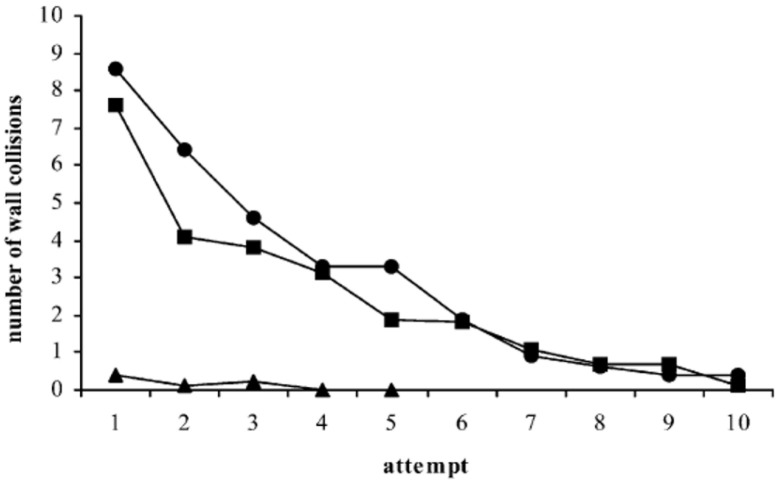
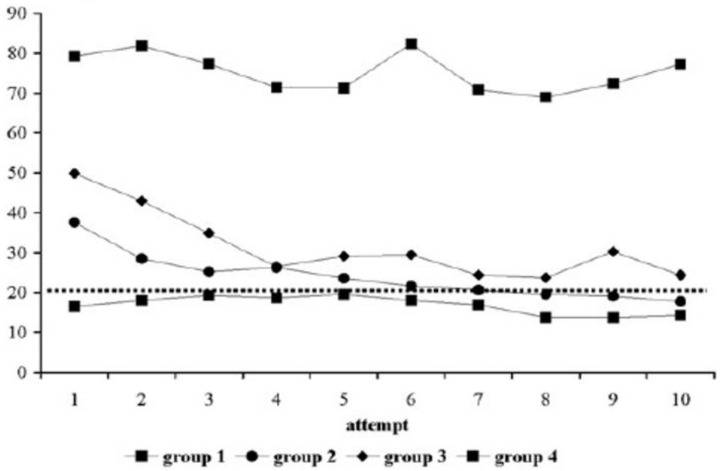
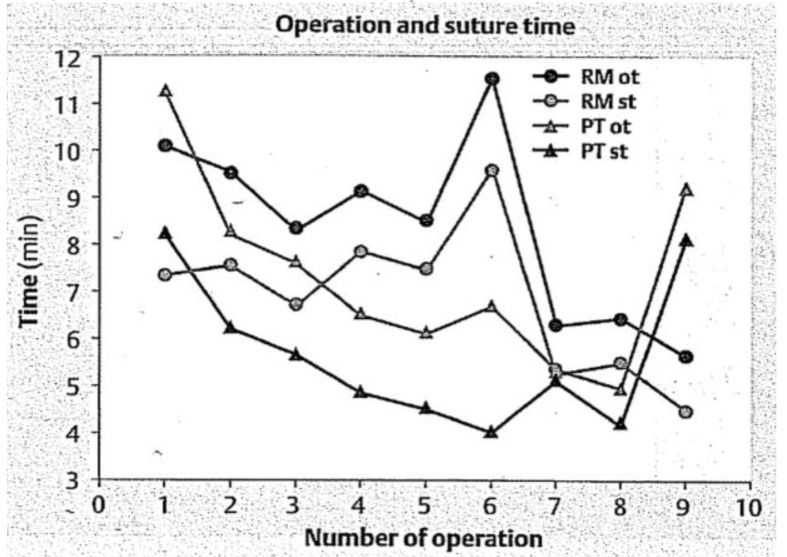
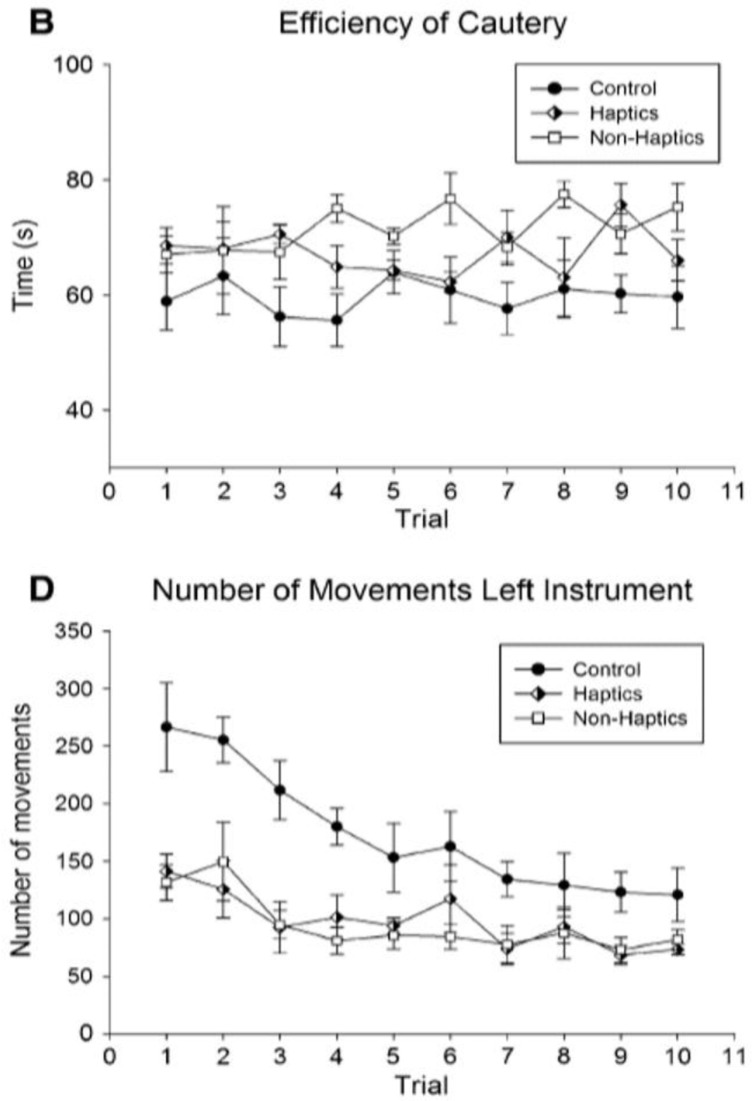
Table 3. Examples of stacked learning curves (same graph or one on top of the other): each have different outcome variables aligned over a similar X-axis which allows for point-by-point comparisons of the variables and overall shape of the learning curves.
This allows for comparison of values for different outcome variables using quick visual analysis.
| Graphical representation | Example graphs |
|---|---|
| The differences in the shapes of the curves demonstrate differences in expertise level. |

Figure 6: Reproduced with permission from Eversbusch & Grantcharov, 2004 ( Eversbusch & Grantcharov, 2004). Note the flat curve of the experts denoted by triangles compared to residents (squares) and medical students (circles) stacked in the same graph. This supports the validity of the intervention as experts by definition should not demonstrate a learning curve in comparison to novices (medical students circles, residents squares, attending experts triangles). |
| A flat curve below the proficiency threshold (increased time in this case) can indicate a need for remediation. |

Figure 7: Reproduced with permission from Grantcharov et al., 2009 ( Grantcharov et al., 2009). All groups are surgical residents at different levels performing a task on a laparoscopic simulator stacked in the same graph. The Y-axis is the time to complete the surgical task with each of 10 repetitions with feedback. Note the top group of residents show no time improvement (both qualitatively and quantitatively). |
| Non-adherence to a typical learning curve shape can suggest that something wrong with the learning context or system. |

Figure 8: Reproduced with permission from Kirlum, Heinrich, Tillo, & Till, 2005 ( Kirlum et al., 2005). Note that the two triangle groups, although they decreased their operating time on the pelvitrainer (PT) for cases 1-8, this skill was not transferred to the operating room on a rabbit model in operation 9, in comparison to the circle groups who practiced on a rabbit model (RM). This suggests that the learning system (the pelvitrainer) needs to be modified. |
| Stacked learning curves of different graphs |

Figure 9: Reproduced with permission from Thompson et al., 2011 ( Thompson et al., 2011). One can grossly intuit that the learning curves in B are seemingly random over attempts with a slight increase across the curves, while D shows more classically shaped learning curves. These comparisons can provide unique insights into learning outcomes. |
