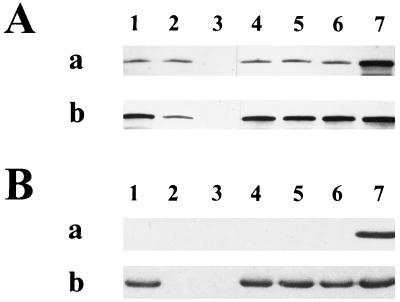
FIG. 5.
Western blot analysis of levels of RpoS and Dps during growth and starvation in wild-type, dnaK, rpoS, and rpoH suppressor strains. (A) Levels of RpoS. Western blot of cell extracts during growth (a) and 24 h after the onset of glucose starvation (b). Blots were probed with anti-RpoS monoclonal antibody. Lanes: 1, PBL500 (wild type); 2, PBL501 (ΔdnaK52); 3, PBL503 (ΔmutS-rpoS458); 4, PBL622 (ΔdnaK52 rpoH-1); 5, PBL623 (ΔdnaK52 rpoH-2); 6, PBL624 (ΔdnaK52 rpoH-3); 7, PBL504 (ΔdnaK52/pPtac::dnaK+ J+) cell extracts from 2 h after the onset of starvation in both panels. (B) Levels of Dps. Western blot of cell extracts during growth (a) and after 24 h of glucose starvation (b). Blots were probed with anti-Dps polyclonal antibodies. Lanes are as indicated for panel A, except that lane 7 contains purified Dps protein standard.

