
Figure 4:
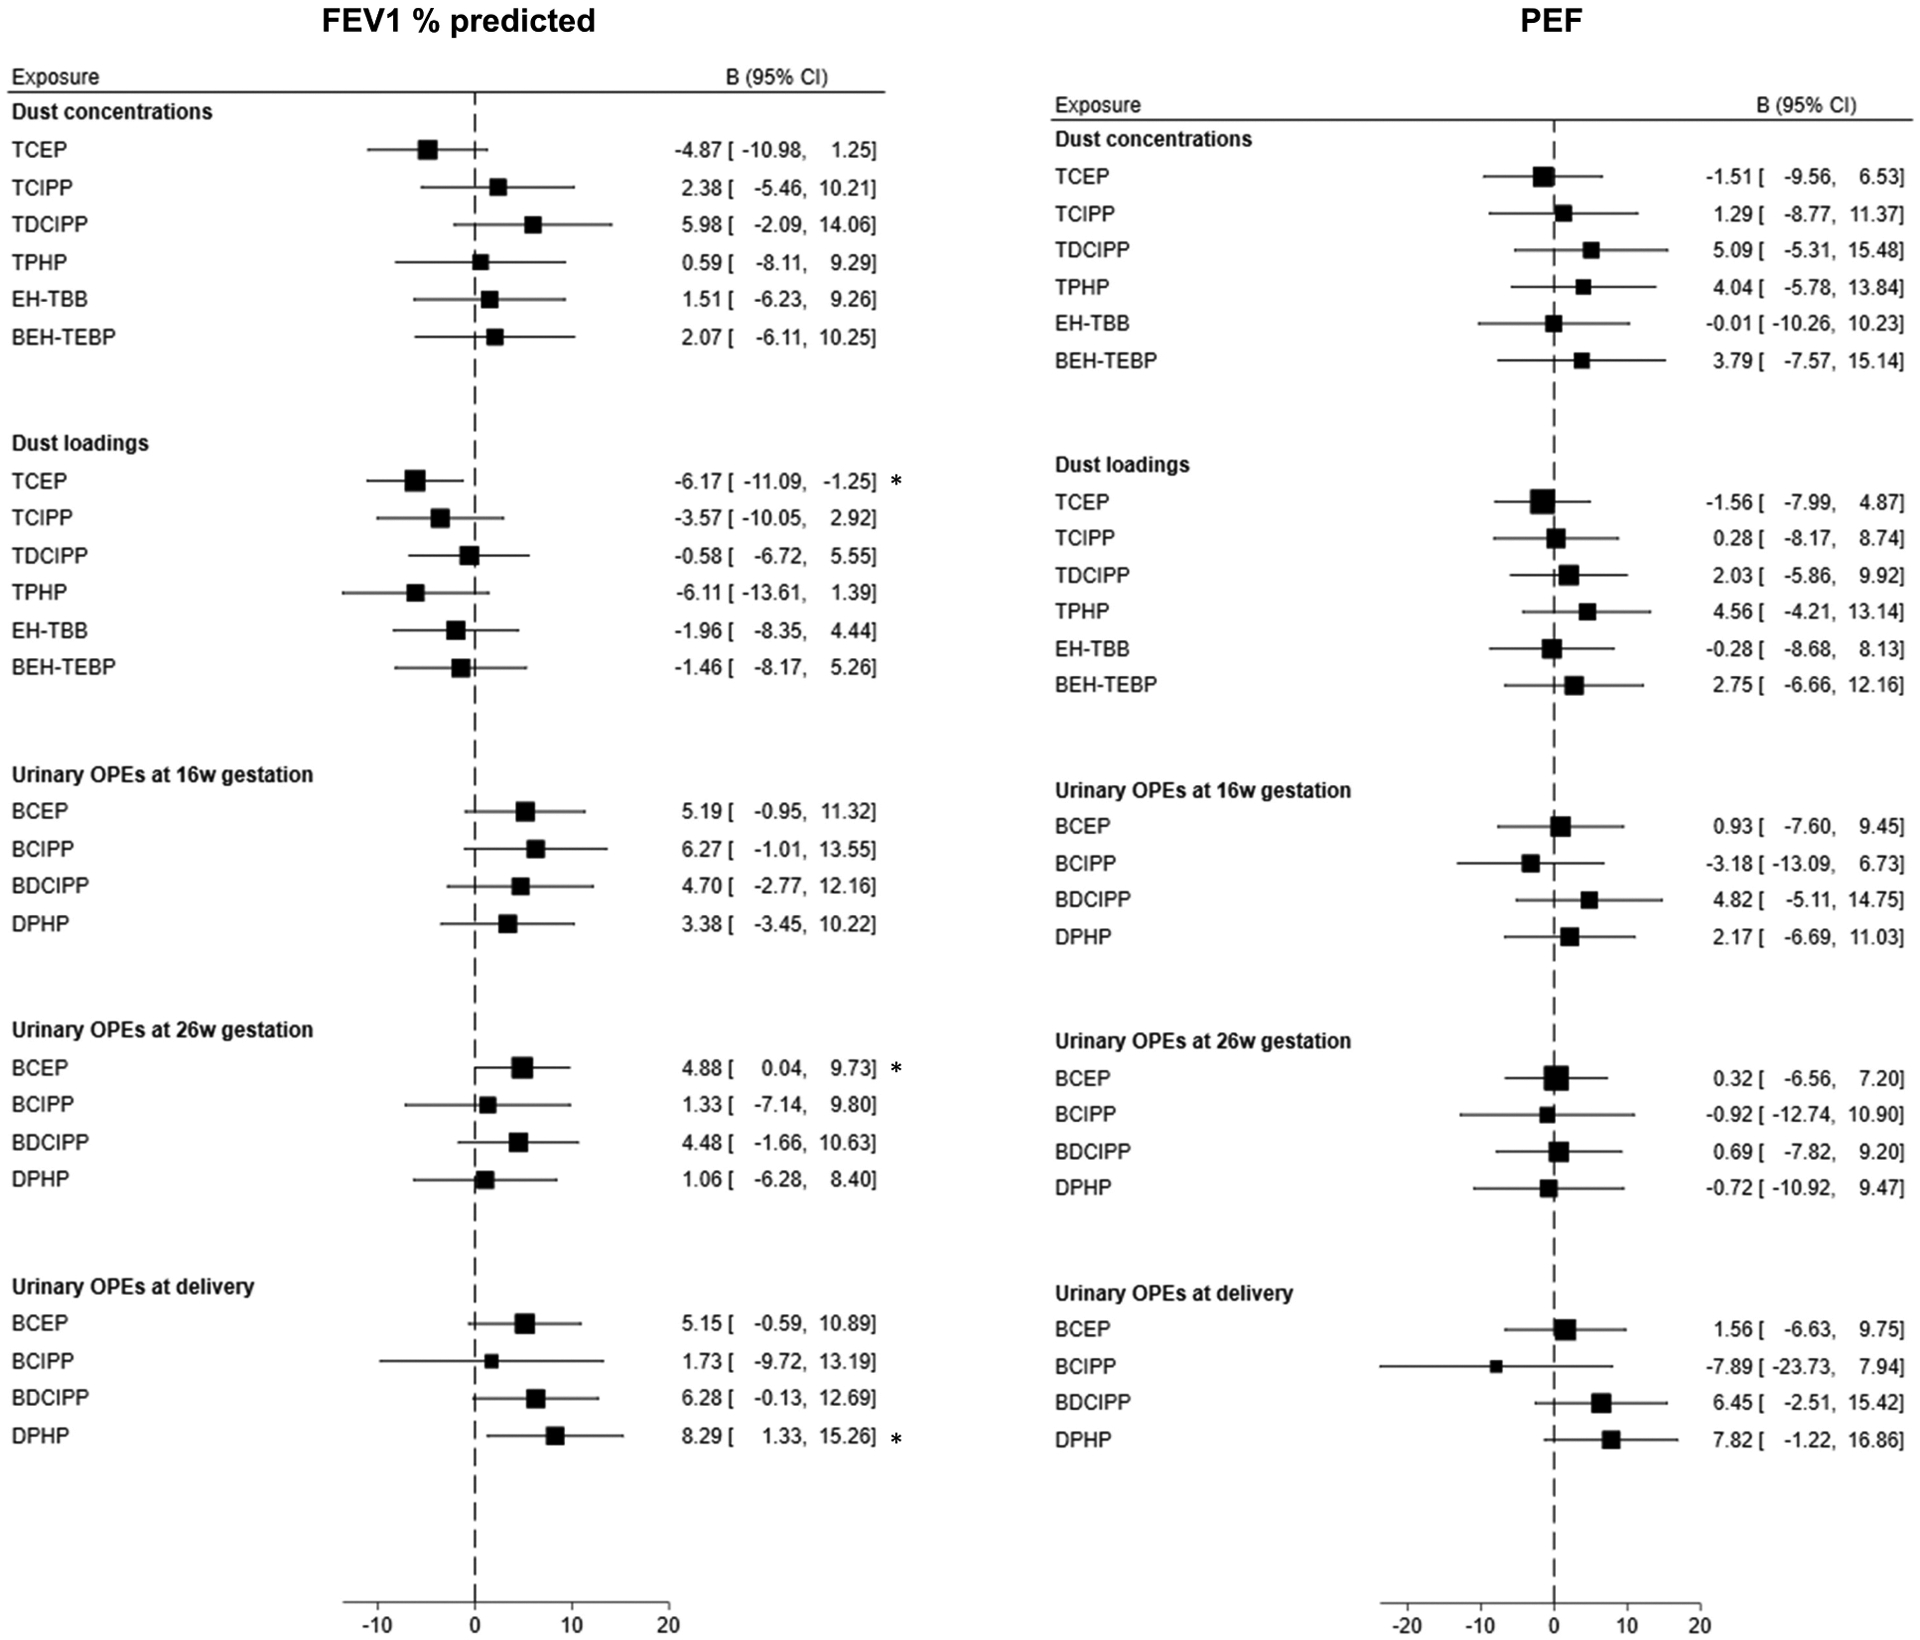
Forest plots for the association of dust OPEs and RBFRs and urinary OPEs with FEV1 % predicted and PEF. Models adjusted for child’s sex, child’s race/ethnicity, birth weight, gestational term, family income, and child receiving breast milk. *P < 0.05