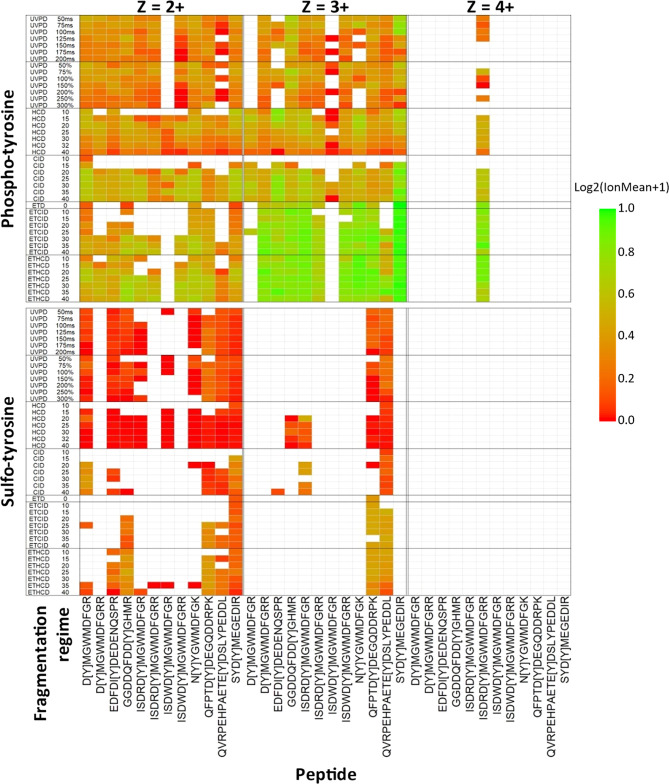
Figure 4.
Comparison of site-determining ions for the sY and pY peptide panel using different fragmentation regimes. Two sample pools were generated containing either the panel of 12 sY- or 12 pY-containing peptides and subjected to LC–MS/MS on the Fusion Lumos Tribrid mass spectrometer (ThermoFisher) using fragmentation conditions as detailed. Ranging NCEs were applied for CID, HCD, ETciD, and EThcD as denoted. The ETD component was charge state-calibrated.90 UVPD activation time was either calibrated to molecular weight (%)91 or manually set (ms). Data were searched with COMET, and the highest scoring PSM was selected for further investigation. The heatmap shows the log2 ratio of the number of observed MS2 product ions containing the known modification mass shift (Δ80 Da) normalized to the total number of potential PTM-containing product ions (log2(ion mean + 1). Ions correlating to fragmentation at the same position in the peptide (e.g., a4/b4, y8/y82+/z8) were collapsed into a single entry. The modification site is depicted by “[Y]”, and charge states are visualized separately. Green = all potential mass shift containing product ions detected; red = no potential mass shift containing product ions detected; white = no MS/MS spectra were confidently identified.

