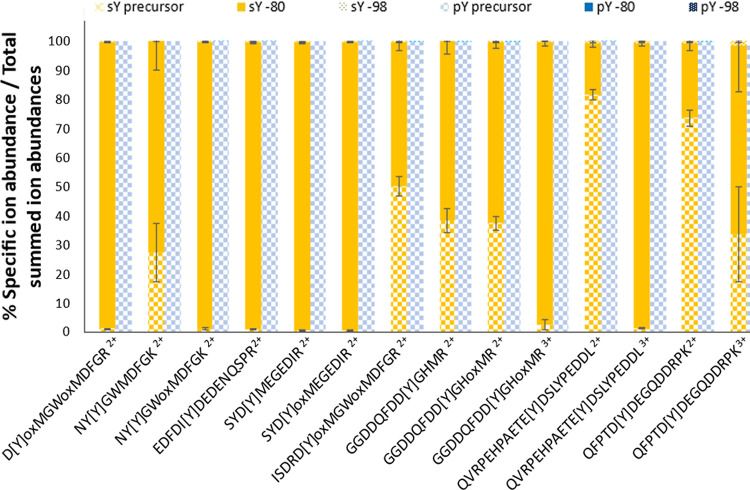
Figure 5.
NL propensity of sY- vs pY-peptides at 10% NCE HCD fragmentation. The most intense PSM (determined from the .mgf file) for each sY and pY peptide at different charges (including oxidized methionine variants) were selected for quantitation (14 peptide ions). The relative abundance (%) of the precursor ion (check), precursor ion −80 Da (block), or precursor ion −98 Da (dotted) was calculated as a proportion of the summed intensity of all ions in the MS2 spectrum. sY-containing peptides in yellow; pY peptides in blue.

