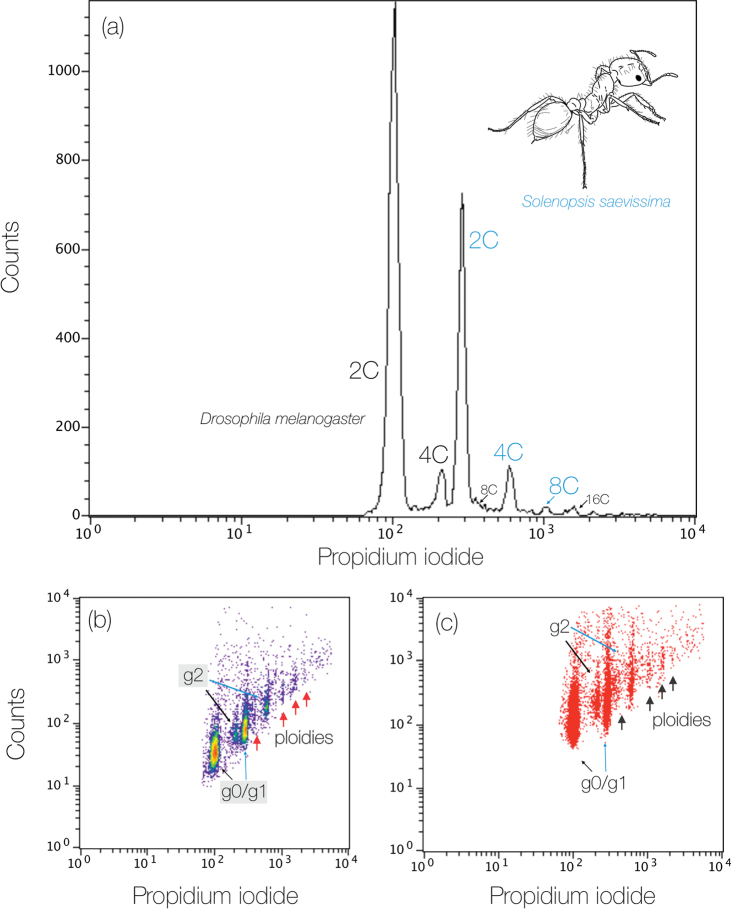
Figure 4.
Genome size of Solenopsissaevissima showing ploidy variations estimated by flow cytometry a histogram highlighting the peaks from 2C to 8C (blue lettering refers to S.saevissima and black lettering refers to the internal standard) b density plot c dot plot containing many events, within which the nuclei occupy a well-defined series of regions, equally spaced in terms of fluorescence and corresponding to 2C, 4C, 8C, and 16C nuclei. Colors in the density plot indicate nuclei population density, with red as the highest and blue as the lowest.

