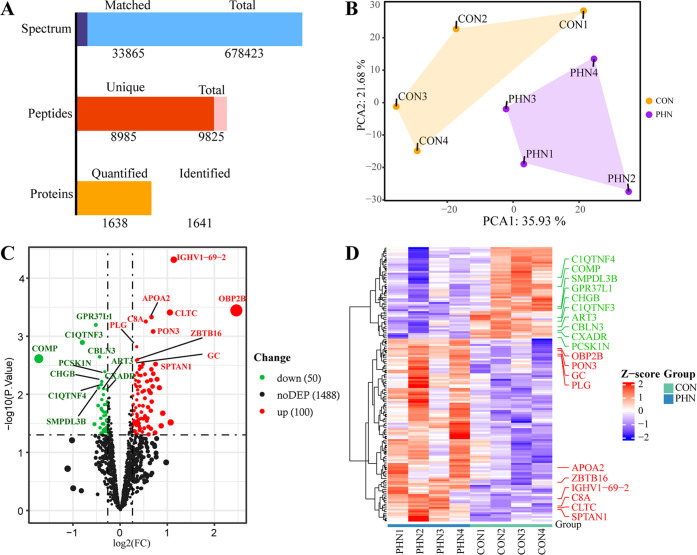
Figure 2.
Protein quantitation and DEP identification (A). Identification and quantitation of proteomics (B). The results of PCA analysis (C). In the volcano map, the green and red dots represent downregulated and upregulated DEPs, respectively, while the dark dots represent proteins with no statistical differences (D). The heatmap showed hierarchical clustering results of all DEPs. Each column represents a sample, and each row represents a DEP; blue and red represent lower and higher expressions of a protein, respectively. In (C, D), the top 10 upregulated (red) and downregulated (green) DEPs are displayed in the figure.

