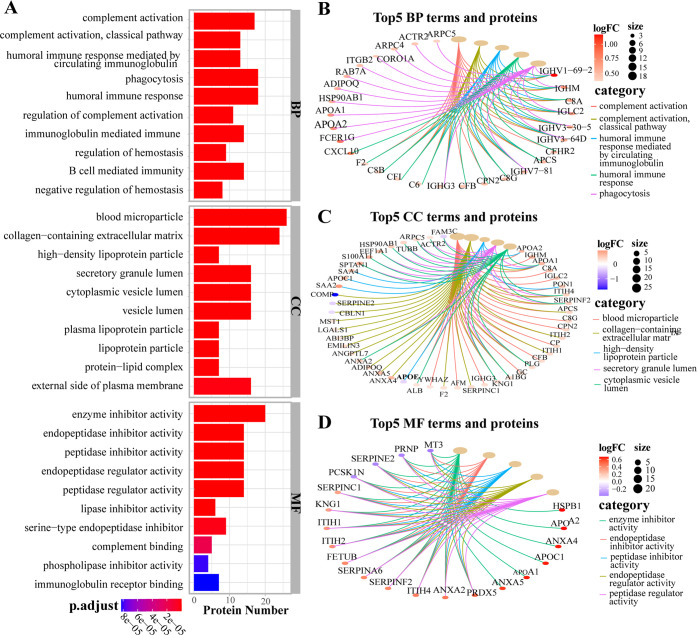
Figure 3.
Gene Ontology (GO) analysis (A). Barplot of the top 10 terms of biological processes (BP), cellular components (CC) and molecular functions (MF) arranged in ascending order of P values respectively. (B–D) Cnetplot of the top 5 terms of BP, CC, and MF and their corresponding proteins network.

